ArcGIS Field Maps
Revised 22 January 2026
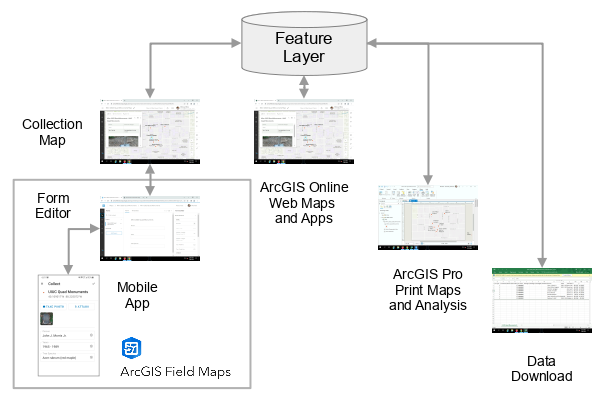
ArcGIS Field Maps includes web and mobile apps integrated with ArcGIS Online that allow users to perform field data capture and editing, find assets and information, and report real-time location information.
Field data is data collected outside of a traditional controlled workplace setting like a laboratory or office (Fulcrum 2023). There are often situations in research, business, or government work where you may need to collect field data that includes a geospatial component. Some research examples of field data collection include:
- Conducting urban tree censuses
- Recording archaeological excavation information
- Recording building damage information after earthquakes
- Tracking violations of campus tobacco use restrictions
- Creating vacant property inventories
This tutorial will demonstrate the use of ArcGIS Field Maps for field data collection.
Capture the Data
Create the Feature Layer
ArcGIS Field Maps collects data and adds features to feature layers. To create a new feature layer in ArcGIS Online:
- Go to your ArcGIS Online Content page.
- Select New Item and Feature Layer.
- Select Define your own layer (the default).
- Under Specify name and type give your new layer a meaningful name (Minn 2023 Quad Monuments).
- Turn on Add GPS metadata fields and Enable Z-values so the GPS accuracy and elevation information is added to your features.
- Click Next and on the New item form, click Save.
- On the new layer page, click Data to add fields.
- In the right side menu, click Add.
- Add the desired fields. The type should be String unless there you are specifically adding fields that you know will always be dates or numbers.
- For this example we will add three fields: Person, Years and Tree_Species.
Create the Map
The data collection form will be based around a map with the feature layer for the new data.
- From your ArcGIS Online Content page, select Map.
- Select Add Layer and add the layer you created above.
- Save the map under a meaningful name (Minn 2023 Quad Monuments).
Create the Form
You will use the data collection map and feature layer to create the form used to capture data.
- From your Content page, select the map to show the information page.
- Select Open in Field Maps Designer.
- If the map is not immediately available as an option, Click the Maps link and select the map you created above. This step may fail to open the editor on some browsers and you may need to try another browser.
- Click the Form icon to open the form editor and select the data collection layer.
- Drag the fields into the form that you wish to be available during data collection.
- Click the floppy disk icon to Save to map.
- Adjust the sharing as needed. If you alone will be gathering data, Private is the best choice.
- Copy the Share with link.
- E-mail the link to your cellphone.
Collect the Data
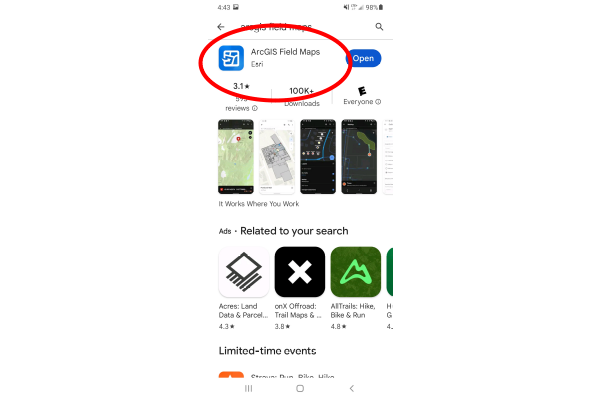
- On your cellphone, install the free ArcGIS Field Maps app.
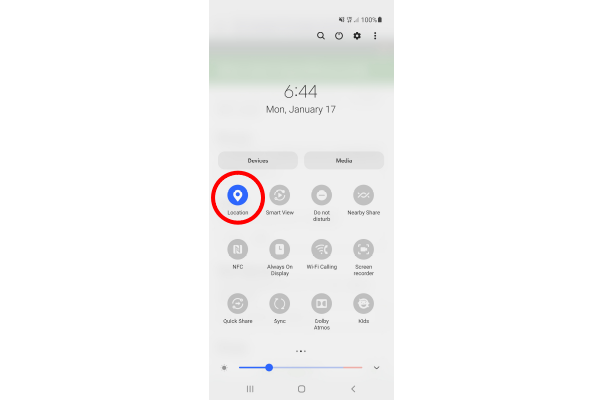
- Turn on location services (GPS) on your phone so you can collect location data.
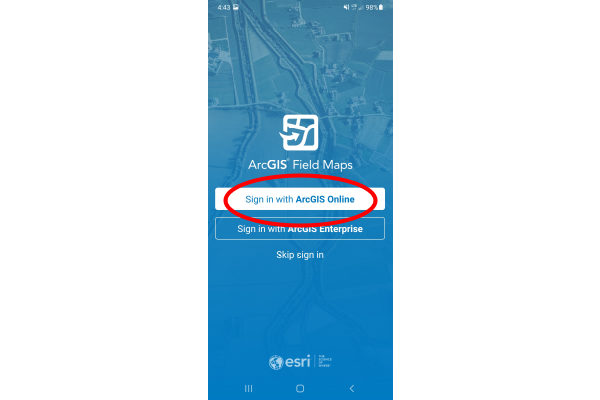
- Open the app and sign in with ArcGIS Online.
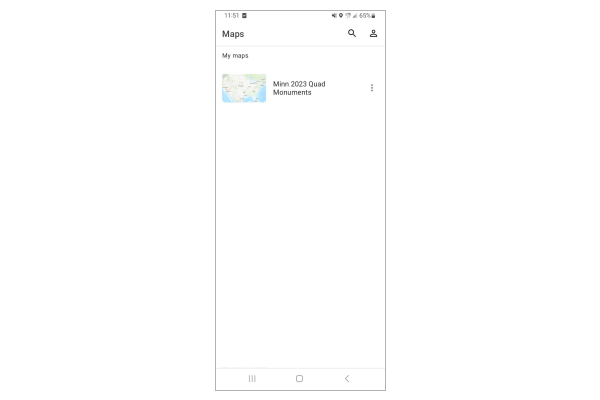
- Find the collection map in the list and tap it to open the map for editing (Minn 2023 UIUC Quad Memorials).
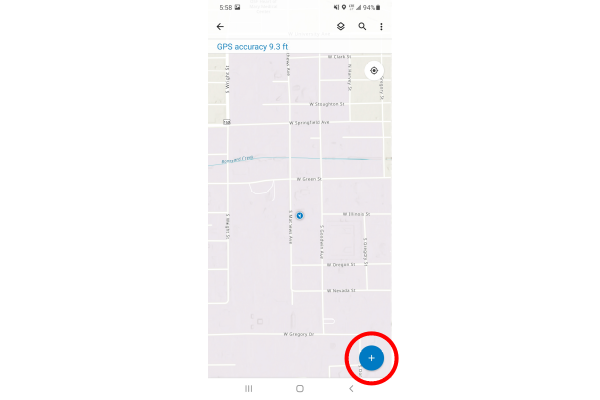
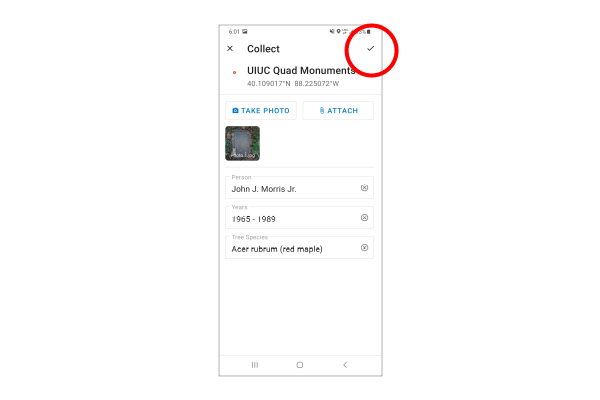
- Go to the location where you are collecting data and tap the plus sign (+) to add a new point.
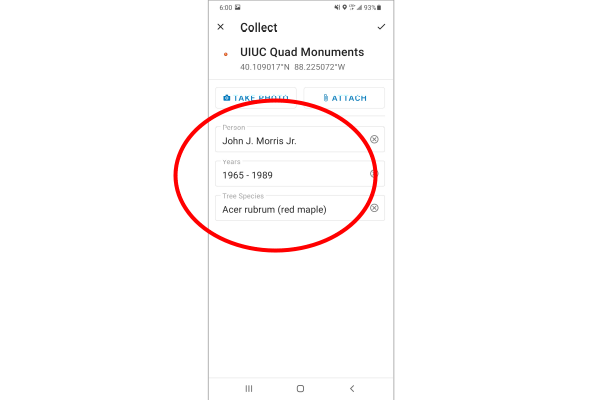
- Fill out the form with the available data.
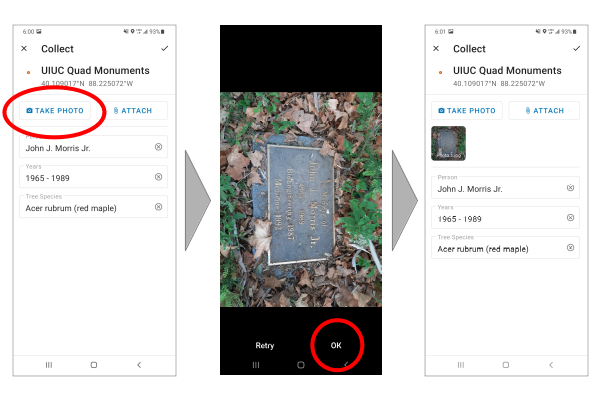
- If desired, take a photo for the point.
- Tap the check mark at the top of the form when you have entered the needed data. Depending on your cell connection, the submission may take a few seconds, especially if you have attached a photo.
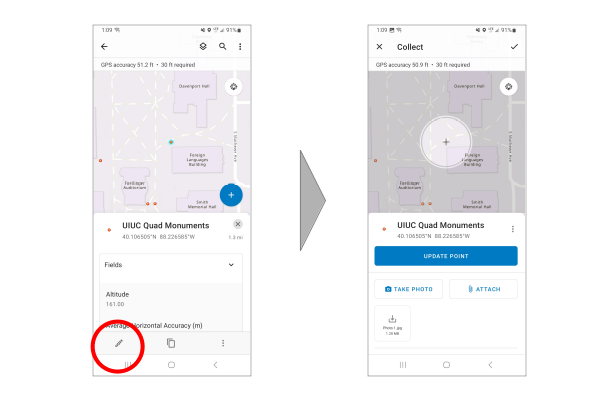
- If you wish to edit the information or location for an existing point, you can tap the point to show the data, and tap the edit button (the pencil) at the bottom of the screen to reopen the editing form.
- If you want to update the location, tap Update Point.
Edit the Data
If needed, you can use the data collection map to review and edit the submissions.
- On your ArcGIS Online Content page, open the collection map.
- Click on any points you want to remove or modify.
- Click Edit at the top of the pop-up and remove or modify the point.
Use the Data
Map the Data
You can use the layer with collected data on a map that you can share with others.
- From your ArcGIS Online Content page, select Map.
- Add the feature layer.
- Click the Properties icon and disable editing.
- If desired, Change Style for the dots (POI, Flag).
- If you want labels, click ellipsis (...), choose Labels, Add label class, select the desired field for the label (Person), and change the the styling if needed.
- Click the ellipsis (...), choose Pop-ups, and adjust the Fields list, and Select fields to show only the needed fields.
- Click the Save icon, select Save As, and save the map into your ArcGIS Online content under a meaningful name (Minn 2023 Quad Monuments Public).
- If needed, change the Sharing of the map to Public if you want it to be visible to people outside your organization. If you share with the Public you will need to disable editing on the feature layer so your data is safe from being accidentally or intentially changed by someone without authorization.
Using Collected Data in ArcGIS Pro
Because the data is stored in a feature service, that data can also be used in ArcGIS Pro for analysis or print mapping.
Export Data
If you need a snapshot of the data at any particular time, you can export the feature service data to an Excel or CSV file from the feature layer information page under Export Data.
Dashboard
An ArcGIS Dashboard can be used to create a cleanly structured user experience.
- Create a map containing the field data feature service.
- Configure popups and Select fields to show only meaningful fields from the feature layer.
- Symbolize as needed
- Set the desired initial map view.
- On your Content page, select Create app and Dashboards.
- Give the dashboard a meaningful name (Minn 2023 Quad Monuments).
- Under View, Add Element a Map element.
- Under View, Add Element a Details element.
- Under View, Configure the map.
- Under Map actions, When map extent changes, Filter the Details element.
- Under Layer actions, When selection changes, Filter the Details element.
- Under When map is clicked, unselect Show pop up and select Select feature.
- Under View, Header, Add header and give the dashboard a meaningful title.
- Under View, select Add mobile view.
- Add the Map element but leave all defaults (i.e. popups) because a mobile screen has no space for additional elements.
- Under Header, Add header and give the dashboard a meaningful title.
Other Apps
ArcGIS Collector is a deprecated app similar to ArcGIS Field Maps. A variation on the assignment above using ArcGIS Collector is described here.
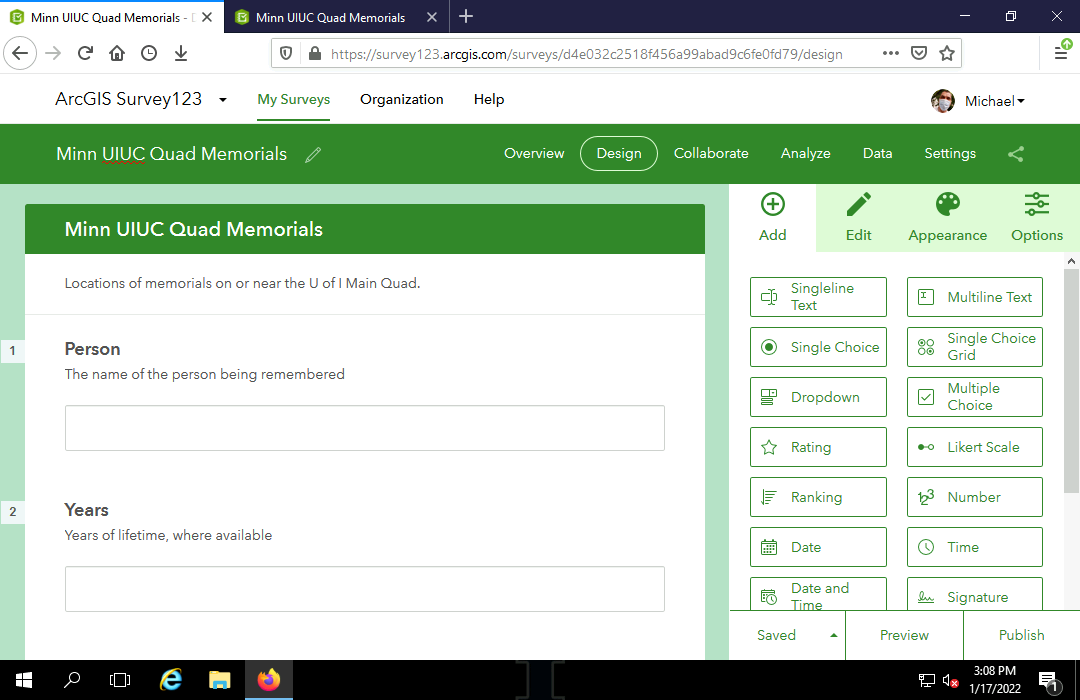
ArcGIS Survey123 is a similar but somewhat less flexible browser-based form-centric data gathering solution. A variation on the assignment above using Survey123 is described here.
Collaboration
When you have multiple users gathering data for the same data set, there are a number of techniques you can employ to address security and improve the quality of the captured data.
Groups
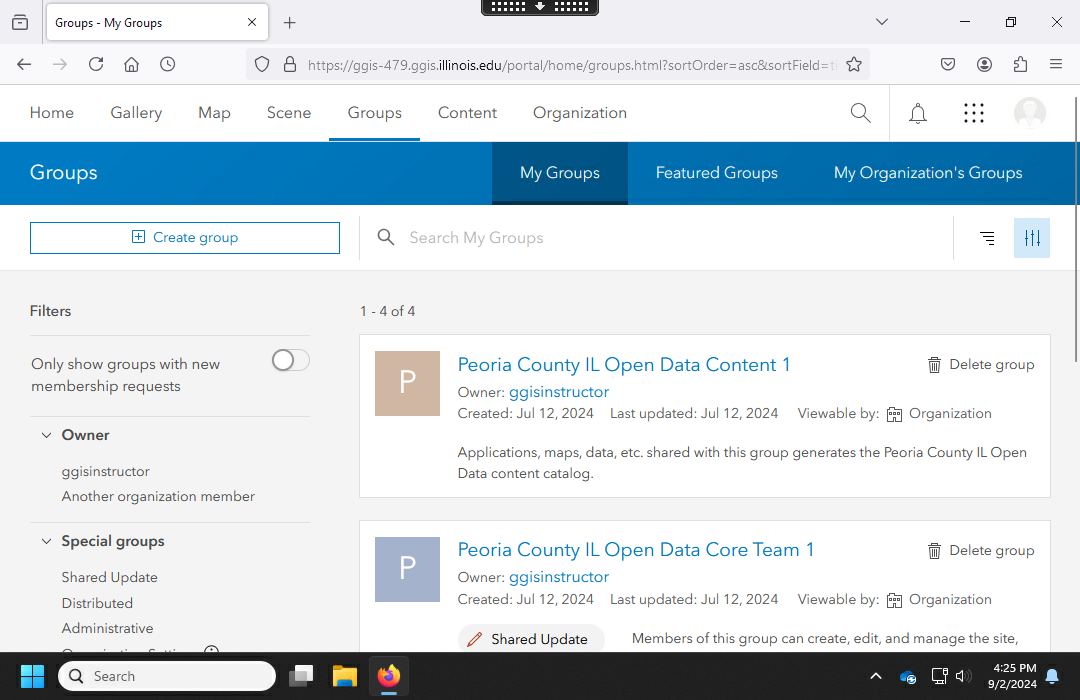
To avoid the security risk of sharing editable forms with Everyone, you should create a Group containing the members of your data capture team and adjust the sharing of your collection feature service, map, and Field Maps form with that group.
Domains
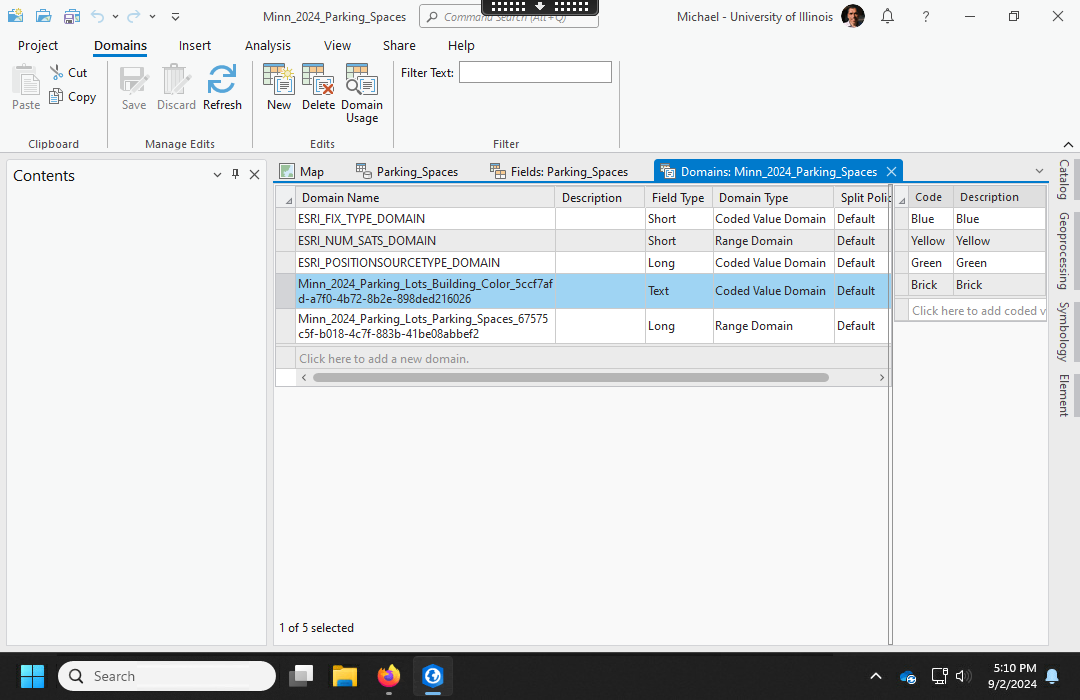
A domain in ESRI software is a range of acceptable values that a field is allowed to contain. Domains are useful for constraining users from inserting invalid or erroneous fields when performing data entry or capture.
Categorical Domains
To add a domain to a text field and make it a categorical variable:
- Go to the Data page and Fields view.
- Select the variable that needs a domain.
- Select Create List.
- Add specific values that can be assigned to the variable.
Numeric Range Domains
To add a domain to a numeric field, go to the Data page and Fields view, select the variable, and edit the Minimum / Maximum values.
ArcGIS Pro Domains
If you publish your collection layer from a project geodatabase or enterprise geodatabase in Pro, your published layer will inherit the domain(s) you configure in the geodatabase.
Domains and the steps for configuring them in geodatabases are described more fully in this help page on how to Create and manage domains.
Standardizing Columns
Standardizing fields refers to the process of conforming the names, data types, and domains of fields in different data sets so that they can be readily compared or combined.
If you will be collecting data in separate feature services that you then merge into a single feature service, you will first need to standardize your data fields.
You may also want to add a field that distinguishes the original source of the data. This can be used for symbology or analysis if the different data sources represent different things, or if you just want to be able to trace back the original source of the data when debugging problems.
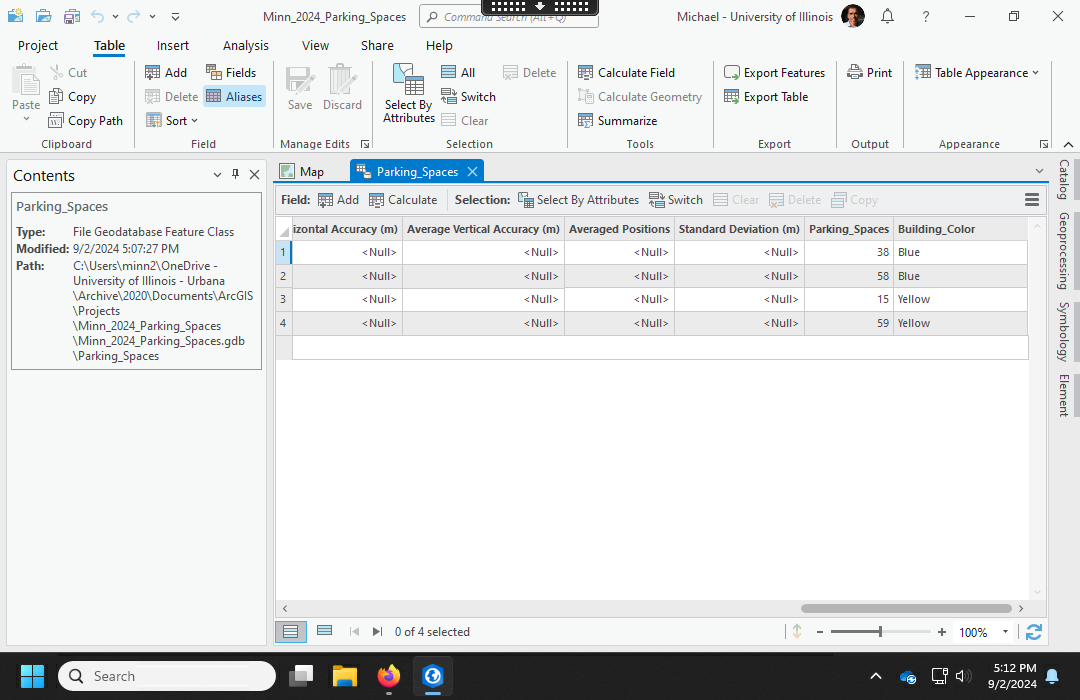
For example, assume you have a team collecting data on buildings and a team collecting data on trees in a neighborhood.
| Building_Color | Parking_Spaces | Collection_Time |
|---|---|---|
| Blue | 58 | 11:25 5/20/2024 |
| Blue | 38 | 11:26 5/20/2024 |
| Yellow | 15 | 11:29 5/20/2024 |
| Yellow | 59 | 11:40 5/20/2024 |
| Tree_Count | Building_Color | Collection_Time |
|---|---|---|
| 9 | Green | 10:25 5/20/2024 |
| 3 | Blue | 10:32 5/20/2024 |
Standardized columns for combining the data sets could be as follows:
| Category | Building_Color | Count | Collection_Time |
|---|---|---|---|
| Parking_Spaces | Blue | 58 | 11:25 5/20/2024 |
| Parking_Spaces | Blue | 38 | 11:25 5/20/2024 |
| Parking_Spaces | Yellow | 15 | 11:26 5/20/2024 |
| Parking_Spaces | Yellow | 59 | 11:29 5/20/2024 |
| Tree_Count | Green | 9 | 10:25 5/20/2024 |
| Tree_count | Blue | 3 | 10:31 5/20/2024 |
Quality Control
Quality control (QC) is "an aggregate of activities (such as design analysis and inspection for defects) designed to ensure adequate quality especially in manufactured products" (Merriam-Webster 2024).
Some factors to consider in QC for field data include:
- Locations appear to be valid.
- Attributes are complete and consistent.
- Spelling and capitalization is consistent.
- There are no duplicate features.
- There are no empty features.
- All features have exactly one photo attachment.
Quality control of attributes can be performed by viewing the attribute table. Quality control of locations can be performed with a web map.
Export Features
You can use the Export Features tool to copy collected data into a project or enterprise geodatabase.
Attachments are photos or documents associated with captured data.
- Because each captured feature can have zero or multiple attachments (many-to-one relationship), attachments are kept in a separate table with entries that are tied to the feature class with a relationship class.
- The attachment table has the suffix _ATTACH and the relationship class has the suffix _ATTACHREL.
- Use of a relationship class assures that the related data travels together with the feature class when using ESRI tools, and that any edits to one table are reflected in the related table.
Merging Feature Services
Once you have standardized your column names, you can use the Merge tool in ArcGIS Pro to merge data from multiple collection feature services into into a single collective feature service.
Merge will preserve relationship classes and attachment tables.
Experience Builder Dashboard
ArcGIS Experience Builder is a web app available through ArcGIS Online or Portal for ArcGIS that can be used to build interactive web applications based on geospatial data without writing code.
You can use Experience Builder to create a dashboard that allows users to interactively explore the attributes.
- Publish and map the data. This example data contains a Category attribute for the type of location and a Technician attribute for the technician who collected the data.
- On your Content page, select Create app and Experience Builder.
- Use the Blank Grid template, which gives you the greatest flexibility for positioning widgets.
- Give the dashboard a meaningful name (Minn 2024 Infrastructure).
- Save often because Experience Builder has a tendency to lock up, especially with large data sets.
- Configure the map.
- Drag a Map widget onto the screen.
- Select map and Add new data with the map for this experience.
- Add charts.
- Drag a Chart onto the screen.
- Select data with the map.
- The Chart type will be Column chart for this categorical Category variable.
- Sort by the COUNT.
- Add a Legend widget.
- Add a Filter widget if you wish to allow the user to isolate specific categories.
- Each filter needs Data, a Label, and an SQL Expression to define what will be filtered.
- Select Apply this filter automatically to default to on.
- Add a Header to the Page.
- Add a meaningful title (Minn 2024 Infrastructure).
- Shrink the height to 70px to avoid wasting space on small screens.
- Remove the unused Menu icon.
- Add the actions
- Configure the Map, Action and Add a trigger for Extent changes.
- On the data Framework select Filter data records with Action data from the main map.
- Publish
- Save and Preview the dashboard.
- Publish the dashboard.
- Set the sharing as needed.
- Copy published item link to get the link to the dashboard that you give to users.