Geocoding in R
This tutorial covers geocoding addresses into lat/long coordinates using nominatimlite.
Installing nominatimlite
You will need to install the nominatimlite package once before using it:
install.packages("nominatimlite")
Geocoding Script
The following script reads addresses from a .csv file, passes the addresses to the Nominatim API, and outputs the address data with added columns for "Latitude" and "Longitude."
- Change address.file to the name of your .csv file containing address. The example file used here is a set of global locations for the investment bank Lazard, which can be downloaded here.
- Change the address.columns names to the names of the columns in your .csv file that you want concatenated into the address string passed to Nominatim.
- Change output.file to the name of the file where you want the geocoded locations.
- geo_lite() makes the call to the Nominatim API.
- write.table() appends the location data with the lat/long to the output file.
- Note the one modification made is the replacement of "#" characters with the word "number" since pound characters cause geo_lite() to fail. Additional modifications can, of course, be added if other problem cases are found in your data set.
The script outputs a message line for each address so you can diagnose failures.
- If a call to the API fails or locks up in the middle of a job, you can also use these lines to indicate what lines you can remove from your input file so you can resume.
- Optionally, you can also change the starting index in the for loop to the line where you want to resume.
library(nominatimlite)

address.file = "2022-lazard.csv"

address.columns = c("Address", "City", "ST", "PostalCode", "Country")

output.file = "geocoded.csv"

locations = read.csv(address.file)

for (x in 1:nrow(locations)) {
	addr = paste(locations[x, address.columns], collapse=" ")

	addr = sub("#", "number ", addr)

	latlong = geo_lite(addr, lat="latitude", long="longitude")

	locations[x, "Latitude"] = latlong$latitude

	locations[x, "Longitude"] = latlong$longitude

	print(paste(x, addr, latlong$latitude, latlong$longitude))

	write.table(locations[x,], output.file, col.names=(x == 1),
		row.names=F, na="", append=T, sep=",")
}
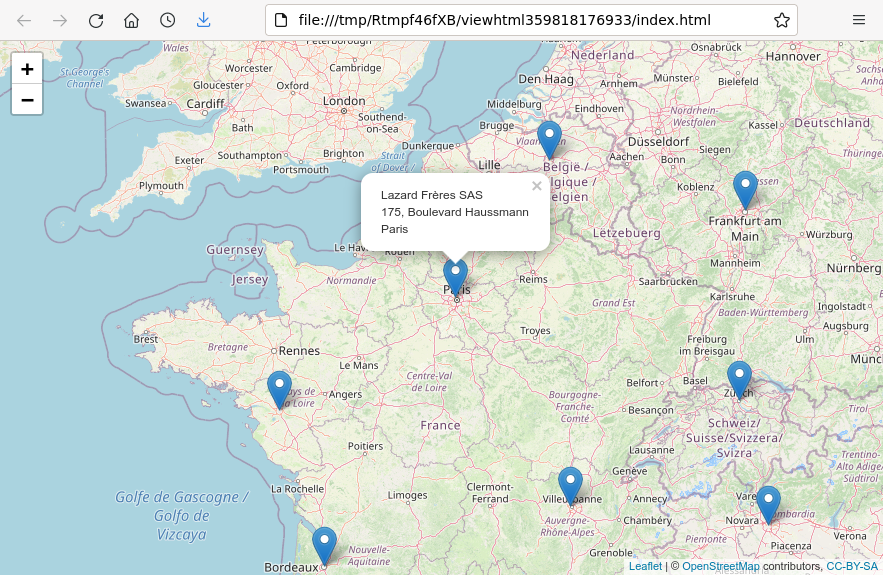
Interactive Display of a CSV File with Leaflet
The Leaflet for R library that allows R to display an interactive map.
If you haven't already, you can install the Leaflet for R library with install.packages().
install.packages("leaflet")
- leaflet() creates the map.
- addTiles() adds a base map to the map using OpenStreetMap tiles.
- read.csv() reads the .csv file with latitudes and longitudes (as created above).
- addMarkers() adds the markers from the .csv file using the Latitude and Longitude columns.
library(leaflet)

map = leaflet()

map = addTiles(map)

markers = read.csv("geocoded.csv")

map = addMarkers(map, lng=markers$Longitude, lat=markers$Latitude,
	popup=paste0(markers$Name, "<br/>",
	markers$Address, "<br/>", markers$City))

map
