Introduction to Python
Rev. 2 December 2025
Python is a cross-platform, open-source, general purpose programming language developed by Dutch programmer Guido van Rossum and first released in 1991.
- Van Rossum named the language Python because he was reading scripts from the Monty Python's Flying Circus TV show while trying to come up with a name, and he felt that "Python" would be appropriately "short, unique, and slightly mysterious" (Python Software Foundation 2022).
- Van Rossum was solely responsible for the project until he ceded responsibility for governance to a five-member steering committee in 2019.
Of the myriad uses for Python, four areas are notable:
- Education: Python has a clear syntax and is feature rich, which makes it both accessible and powerful, which in turn makes it a popular language for teaching programming concepts.
- Analytics: Those same characteristics make Python a common language (along with R) for data analytics and data science. Python works well in notebooks with integrated text.
- Software plugins and extensions: Python is commonly used to customize and extend the capabilities of software using Python application programmer interfaces (APIs). Examples include GIS software like ArcGIS Pro and QGIS, and the 3D graphics software Blender.
- Web development: Python can be used for server side web programming with frameworks like Django.
This tutorial will give a brief introduction to the syntax of the Python programming language and basic usage of geospatial data in Python.
Jupyter Notebooks
A notebook is an interactive interface that allows you to integrate programming code with documentation, analysis, and visualizations.
Jupyter notebooks were developed by Project Jupyter, which was spun off from the IPython interactive computing project in 2014.
- The name Jupyter is a portmanteau formed from the names of the three core languages supported by the project: Julia, Python, and R (Wikipedia 2021).
- Notebooks are an incarnation of the concept of literate programming, codified by Donald Knuth in 1984.
- Knuth proposed that programming methodology had progressed to a point where the main focus of programming needed to change from instructing computers what to do, to explaining to other human beings what we want the computer to do.
Jupyter on the Desktop
Jupyter Notebooks on a desktop computer runs as a local web client for the user to interact with in a web browser.
Jupyter Notebooks is commonly installed on academic lab machines.
On personal machines, you can install Jupyter Notebooks using pip in Python.
To create a new Jupyter notebook:
- Start Jupyter Notebooks from the Windows Start menu.
- At the Home Page, create a New Python 3 notebook.
Jupyter Console
A Python console allows you to directly interact with Python software by typing in commands line-by-line and observing results.
Jupyter Notebooks provides console kernels for quick execution of Python commands for calculation and syntax checking.
When you have typed in the commands, press Shift-Enter to execute them.
Renaming a Notebook
To rename a notebook to something more meaningful than Untitled:
- File, Save the notebook
- File, Close and Shut Down Notebook
- In the Files window, right click and Rename (Minn 2023 State Energy)
- Double click the renamed notebook to reopen it.
Markdown Cells
Jupyter notebooks are composed of cells, which are individual sections of the notebook that can contain programming code (Python) or text (markdown).
To add a heading to your notebook:
- Change the cell type to Markdown.
- Add the top level heading by preceding your text with a pound (#) sign.
- Add additional text as needed.
- Run the markdown cell to see what it will look like when rendered.
# State Energy Profiles

Michael Minn

16 November 2025
Code Cells
New cells for code can be added by clicking the plus sign (+) on the toolbar.
Log Out
When you are finished with your notebook, save and shut down Jupyter Notebooks.
Reopening a Notebook
To reopen a notebook, find it in the directory list Jupyter Notebooks Files screen and double-click to reopen.
If you need to access Jupyter files outside of Jupyter Notebooks, by default, Jupyter Notebooks on Windows keeps files in the /users/username folder.
JupyterHub
JupyterHub is a web-based multi-user version of Jupyter notebooks designed for companies, classrooms and research labs.
JupyterHub can be useful when working with data sets that are too large for personal computers, or when working in a collaborative environment where a consistent software version image is needed by all users.
Members of the University of Illinois community can access a JupyterHub installation through the CyberGIS I-GUIDE project.
- Go to the I-GUIDE platform.
- Log in
- Click the jupyter logo at the top right corner of the page to open the JupyterHub.
Expressions
At it's simplest, you can use Python as a calculator and it will display the value of mathematical expressions.
2 + 2
4
Python expressions are are similar to traditional mathematical notation and use the same mathematical symbols or operators: + - * /. The double asterisk operator (**) is used for exponents.
| Operation | Example | Output |
|---|---|---|
| Addition | 10 + 2 | 12 |
| Subtraction | 10 - 2 | 8 |
| Multiplication | 10 * 2 | 20 |
| Division | 10 / 2 | 5 |
| Exponents | 10**2 | 100 |
As with traditional mathematical notation, parentheses can be used to add clarity to expressions, or to override the normal precedence of operators.
3 + 2 * 4
11
(3 + 2) * 4
20
Objects
To make it possible to use the values of calculations in subsequent formulas, you can assign values to named objects.
- The symbolic names used to refer to objects are called variables.
- In Python, objects are areas in memory where data is stored, and variables are names that point to those areas in memory (Eubank 2022).
- You can use variables in later expressions to save the effort of repeating calculations, or simply to make expressions easier to read.
To display the contents of a object at the console, you simply type in the variable.
x = 10 * 2
x
20
x + 15
35
Variable Naming Styles
Variables must start with a letter and are case sensitive.
hello = 12

Hello = 15

hello
12
Hello
15
You should always try to make your variables meaningful so that you and other people can understand what your objects are. Rather than calling a object containing a standard deviation "s" you might call it "stdev". The extra time spent typing now may save you confusion later.
Variables cannot contain spaces. However there are techniques for representing multi-word variables that get around this issue:
- wordword (lower case)
- word_word (underscore)
- wordWord (camelback or camelCase)
- WordWord (CapWords)
Note that the Style Guide for Python Code generally recommends CapWords formatting, although this is far from a universally followed convention.
Strings
One of the most powerful features of Python is that objects can contain many different types of data.
Objects can contain text. Segments of text are called strings of characters. You assign text by enclosing your text in either double or single quotation marks.
Be aware that text strings and variable names are separate things.
x = "Hello"

x
'Hello'
Hello = "Goodbye"

Hello
'Goodbye'
The plus (+) operator can be used to concatenate (combine end to end) multiple strings (Lofsöngur).
country = "Iceland"

anthem = "Lofsöngur"

print('The national anthem of ' + country + ' is "' + anthem + '."')
The national anthem of Iceland is "Lofsöngur."
Lists
In statistical calculations, we commonly deal with multiple numbers at the same time. One of the most powerful features of is that it permits objects to contain multiple numbers at the same time. These collections of numbers are called lists.
Lists can be created by enclosing multiple numbers, strings, or variables in square brackets, and separating the values with commas:
x = [1,3,5,7,10]

x
[1, 3, 5, 7, 10]
You can perform operations on lists using mathematical operators.
The plus sign concatenates (combines) two lists.
x = ['Alpha', 'Beta', 'Gamma']

y = [1, 2, 3]

x + y
['Alpha', 'Beta', 'Gamma', 1, 2, 3]
The multiplication sign repeats the contents of a list by the given number of times.
y = [1, 2, 3]

y * 3
[1, 2, 3, 1, 2, 3, 1, 2, 3]
Dictionaries
Dictionaries in Python are collections of objects similar to lists, except rather than accessing elements with numbered indices, elements in a dictionary are accessed using values called keys.
Dictionaries can be constructed by specifying key:value pairs within brackets { }.
Dictionary values can be accessed by specifying the key in square brackets [ ].
anthems = {
'United States': 'The Star-Spangled Banner',
'Canada': 'Oh, Canada',
'Mexico': 'Himno Nacional Mexicano',
'Russia': 'Patrioticheskaya Pesnya' }

anthems['Russia']
'Patrioticheskaya Pesnya'
You can add or change dictionary values using that same square bracket notation:
anthems['Ukraine'] = 'Derzhavnyy Himn Ukrayiny'

anthems['Ukraine']
'Derzhavnyy Himn Ukrayiny'
List entries can be used in expressions just like other variables.
anthems['Russia'] = 'Госудáрственный гимн Росси́йской Федерáции'

print('The national anthem of Russia is ' + anthems['Russia'] + '.')
The national anthem of Russia is Госудáрственный гимн Росси́йской Федерáции.
Variables can be used as keys.
country = "Ukraine"

print("The national anthem of " + country + " is " + anthems[country] + ".")
The national anthem of Ukraine is Derzhavnyy Himn Ukrayiny.
Functions
A Python function is "a series of statements which returns some value to a caller" (Python Software Foundation 2022).
You call a function with a function name, an open parenthesis, a set of zero or more parameters separated by commas, and then a closing parenthesis. The function then returns an object based on the parameters.
name(parameter1, parameter2, ...)
Python has dozens of built-in functions that are available with a default installation.
The basic descriptive statistical functions are similar to those available in Excel.
x = [2, 5, 13, 24, 35, 40, 35, 24, 13, 5, 2]

max(x)
40
Functions that return numeric values can be used in mathematical expressions just like numbers or variables.
y = sum(x) + 2

y
200
print()
The built-in print() function is often used in scripts to display the value of variables or expressions to the screen. While simply typing in the expression or variable will display the value in the Python console, in scripts simply putting a variable alone on a line causes no action.
x = 45 + 72

print(x)
117
str()
If you wish to append a numeric value to a string, you must first use a type convertor like the built-in str() function to convert the number to a string before you can append.
This example also uses the round() function to round the value to two decimal places, which is consistent with display as dollars and cents.
dinner = (18.50 + 4.5 + 22.99 + 4.5) * 1.24

print("The total cost for our dinner with tax and tip was $" + str(round(dinner, 2)) + ".")
The total cost for our dinner with tax and tip was $62.61
range()
The built-in range() function is useful for generating lists of values. The first parameter is the starting value, the second parameter is the value immediately after the last value.
range(1, 10)
range(1, 10)
range() returns a range object, and you can use the list() function to convert the range to a list.
list(range(1,10))
[1, 2, 3, 4, 5, 6, 7, 8, 9]
An optional third parameter gives the spacing between values (defaulting to one).
list(range(1, 10, 3))
[1, 4, 7]
User-Defined Functions
Users can create custom functions using the def keyword.
For example, this function calculates the hypotenuse of a right triangle using the Pythagorean theorem (勾股定理).
- The def line contains the function name, followed by the function parameters, followed by a colon (:).
- All lines in the block of code that comprise the function are indented one tab space from the def line. Python is an indent-based language.
- The return line specifies the value returned by the function.
def hypotenuse(rise, run):
    return ((rise**2) + (run**2))**0.5

hypotenuse(3, 4)
5.0
Modules
A module is a set of functions and other objects that you can include in your script.
Specialized functions can be brought in from modules that permit different types of operations to be performed on different types of data.
Statistics Module
For example, the statistics module adds functions for calculating descriptive statistics for lists of numeric values.
Modules are loaded with the import command.
import statistics

x = [2, 5, 13, 24, 35, 40, 35, 24, 13, 5, 2]

statistics.mean(x)
18
statistics.median(x)
13
statistics.stdev(x)
14.26184
Paths: The os Module
A commonly used module for accessing operating system capabilities is the os module.
The os.getcwd() function returns the name of the current working directory.
import os

os.getcwd()
'C:\\Program Files\\Python39'
You can use The os.listdir() function returns a list of files in the directory passed as a parameter. This can be useful if you need to perform some kind of operation on every file in a directory.
path = os.getcwd()

os.listdir(path)
[ 'Documents',
  'Downloads',
  'Photos',
  'Music']
Directories exist within a hierarchical system of directories used to organize files.
- A path is a sequence of directories separated by backslashes (\).
- Because the backslash is an "escape" symbol in Python, backslashes are represented with two backslashes back-to-back (\\).
- On Windows systems, the top level (beginning) directory is usually underneath a drive letter indicating the system where the directories are located.
C:\\Program Files\\Python39
The os.listdir() function returns a list of all the files in a directory. For example, the Program Files directory on Windows systems contains (as the name indicates), the files for the software installed on the system.
os.listdir("c:\\Program Files")
['7-Zip', 'Agisoft', 'ArcGIS', 'Common Files', 'Dell', 'desktop.ini', 'dotnet',
'Emulex', 'Exelis', 'GDAL', 'GeoDa Software', 'Golden Software', 'Google',
'Gwb', 'Internet Explorer', 'LAPS', 'LAStools', 'Managed Defender', 'MATLAB',
'Microsoft MPI', 'Microsoft Office', 'Microsoft Policy Platform',
'Microsoft Silverlight', 'MSBuild', 'Notepad++', 'PackageManagement', 'Python310',
'Python37', 'Python38', 'Python39', 'QGIS 2.18', 'QGIS 3.10', 'QGIS 3.16',
'QGIS 3.22.7', 'QGIS 3.4', 'R', 'Reference Assemblies', 'RStudio', 'rtools40',
'SedInConnect', 'SIFT3D 1.4.5', 'TauDEM', 'tempini', 'Uninstall Information',
'VcXsrv', 'Windows Defender', 'Windows Firewall Configuration Provider',
'Windows Mail', 'Windows Media Player', 'Windows Multimedia Platform', 'Windows
NT', 'Windows Photo Viewer', 'Windows Portable Devices', 'Windows Sidebar',
'WindowsApps', 'WindowsPowerShell', 'Zabbix']
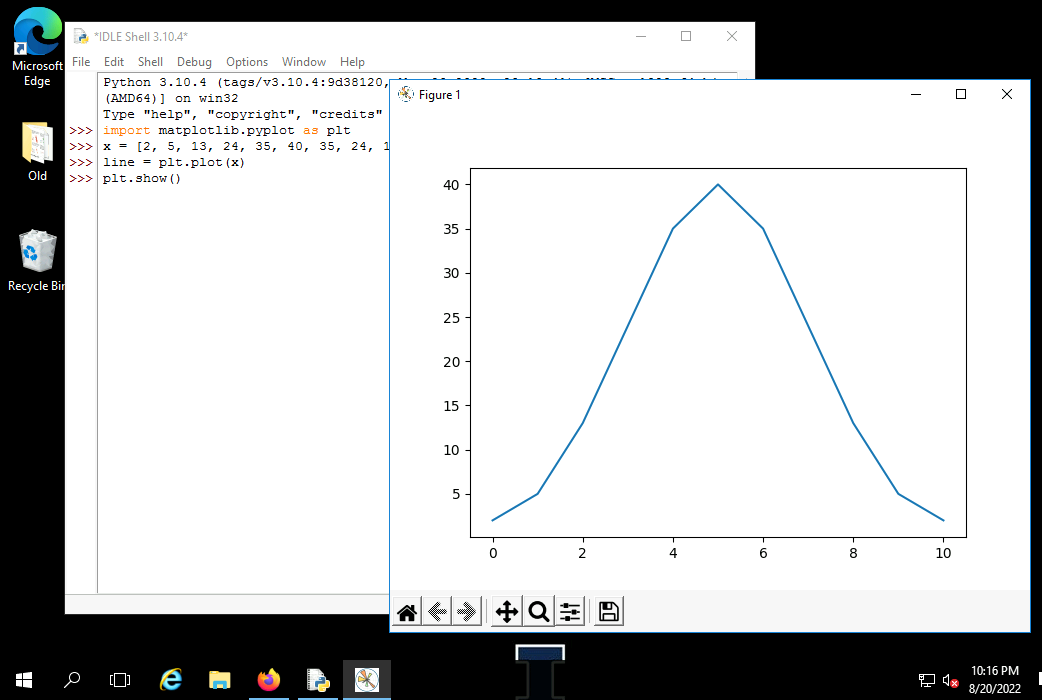
Graphs: The matplolib Module
The matplotlib library permits visualization of data in Python.
The plot() function draws graphs. By default, when passed a single list, the plot() function draws a line graph.
import matplotlib.pyplot as plt

y = [2, 5, 13, 24, 35, 40, 35, 24, 13, 5, 2]

graph = plt.plot(y)

plt.show()
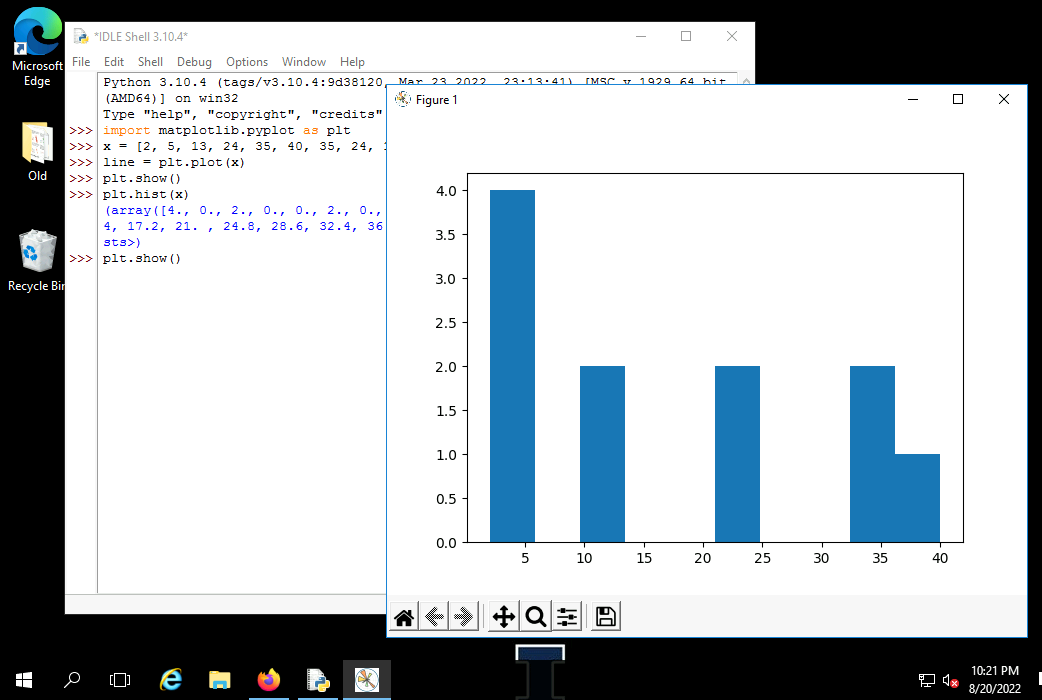
Histograms can be plotted with the hist() function.
graph = plt.hist(x)

plt.show()
Conditions
Python provides operators for comparing values that return logical values (true or false):
- Equals: a == b
- Not Equals: a != b
- Less than: a < b
- Less than or equal to: a <= b
- Greater than: a > b
- Greater than or equal to: a >= b
Comparison operators are commonly used with if statements to choose whether to execute a block of code.
Note that the if statement ends with a colon (:) and, as with functions, the block of code controlled by the if statement is indented.
latitude = 89

if latitude > 90:
    print("Invalid latitude: ", str(latitude))
Invalid latitude: 91
latitude = 91

if latitude > 90:
    print("Invalid latitude: ", str(latitude))
Iteration
A for loop is used to run a block of code on all items in a list.
values = [14, 69, 32, 75]

for x in values:
    print(x)
14
69
32
75
One common application for for loops is to perform some operation on all the files in a given directory.
import os

path = "C:/Documents/ArcGIS Pro/Projects/Merge/Sources"

for file in os.listdir(path):
	print(path + '/' + file)
C:/Documents/ArcGIS Pro/Projects/Merge/Sources/Alpha
C:/Documents/ArcGIS Pro/Projects/Merge/Sources/Beta
C:/Documents/ArcGIS Pro/Projects/Merge/Sources/Gamma
C:/Documents/ArcGIS Pro/Projects/Merge/Sources/Delta
Python has an in operator that can be used to examine whether one object contains another object. With strings, the in operator can be used to check whether a string contains a substring.
In this example, in is used with an if statement to list only the Word documents (.docx) files in a directory and ignore all others.
import os

path = "c:/Documents/ArcGIS Pro/Projects/Merge/Sources"

for file in os.listdir(path):
	if ".docx" in file:
		print(path + '/' + file)
C:/Documents/ArcGIS Pro/Projects/Merge/Sources/Alpha
C:/Documents/ArcGIS Pro/Projects/Merge/Sources/Beta
C:/Documents/ArcGIS Pro/Projects/Merge/Sources/Gamma
C:/Documents/ArcGIS Pro/Projects/Merge/Sources/Delta
Comments
Comments in scripts are lines that the program ignores. These lines are used for documenting the authorship of scripts and for adding comments that explain what is going on when you have complex sequences of expressions and function calls.
Comments start with a pound sign (#) and tell the Python interpreter to ignore everything that follows on that line.
# Name of script (date)
# This is a comment that explains what the line after it does

x = 2 + 2
print(x)
4
Mapping with GeoPandas
Example Data
The following code loads state energy profile data that will be used in this tutorial.
- GeoPandas is a Python package for working with geospatial data.
- You will also need the matplotlib package to plot() maps.
- You can read geospatial data from a file or web source into a GeoDataFrame object using the read_file() function.
- For this example, we will use a GeoJSON file (2019-state-energy.geojson) of state-level energy production and consumption election data from the US Energy Information Administration (EIA).
- You can get a list of available fields and their types using the field (column) names using the GeoPandas info() function.
- Press the Run button to run the code.
import geopandas

import matplotlib.pyplot as plt

states = geopandas.read_file("https://michaelminn.net/tutorials/data/2019-state-energy.geojson")

states.info()
RangeIndex: 53 entries, 0 to 52
Data columns (total 42 columns):
 #   Column                           Non-Null Count  Dtype
---  ------                           --------------  -----
 0   ST                               53 non-null     object
 1   Name                             53 non-null     object
 2   GEOID                            53 non-null     object
 3   AFFGEOID                         53 non-null     object
 4   Square.Miles.Land                53 non-null     float64
 5   Square.Miles.Water               53 non-null     float64
 6   State.Name                       51 non-null     object
...
 36  CO2.Per.Capita.Tonnes            51 non-null     float64
 37  Renewable.Standard.Type          51 non-null     object
 38  Renewable.Standard.Name          51 non-null     object
 39  Renewable.Standard.Year          38 non-null     float64
 40  Senators.Party                   50 non-null     object
 41  geometry                         53 non-null     geometry
dtypes: float64(33), geometry(1), object(8)
memory usage: 17.5+ KB
If you get a No module named 'geopandas' message, you can install it with the pip command in a code cell or from the console. You will need to log out of the notebook and restart the kernel for the module to be available.
pip install geopandas
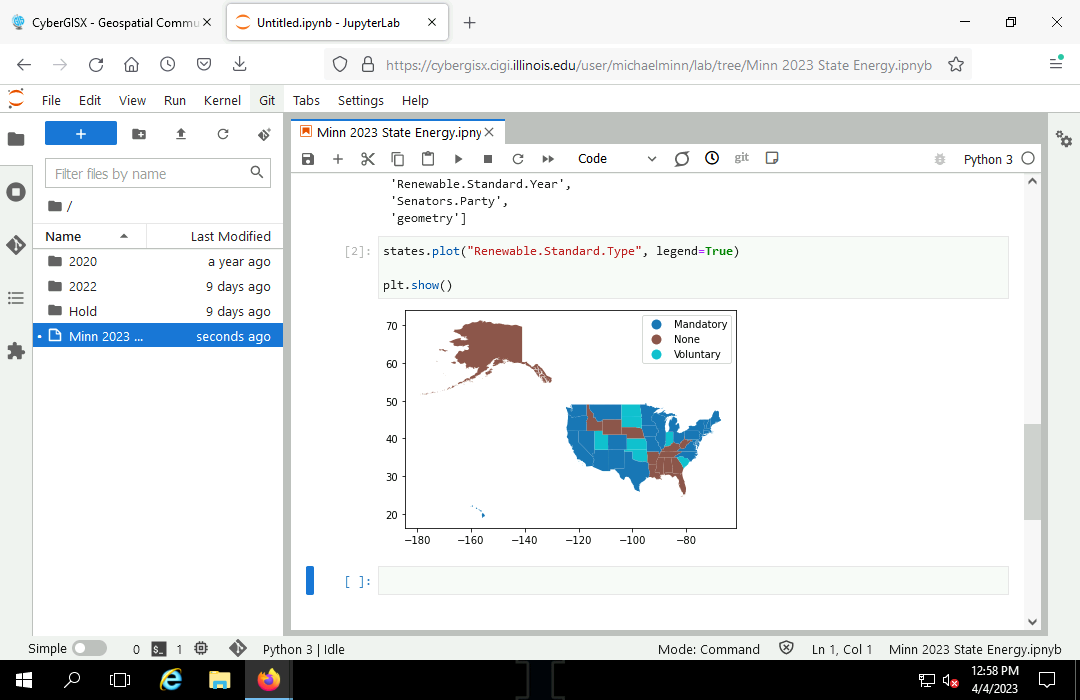
Mapping Categorical Attributes
Methods are functions that are associated with specific classes of objects. While functions can stand alone, methods, as the name implies, perform actions on or based on the contents of the classed objects that they are called with.
Methods are foundational to object-oriented programming where the complexity of operations on objects are hidden from the programmer so they can focus on the high-level objectives of the program rather than the low-level details of operations on complex objects.
- Choropleth maps can be created from a GeoDataFrame using the plot() method.
- The attribute used to color the areas should be specified as the first argument.
- The pyplot set_axis_off() function turns off the axis scale around the map, which is unnecessary with a projected map.
- In order display the plot, you need the pyplot show() function.
states.plot("Renewable.Standard.Type", legend=True)

plt.show()
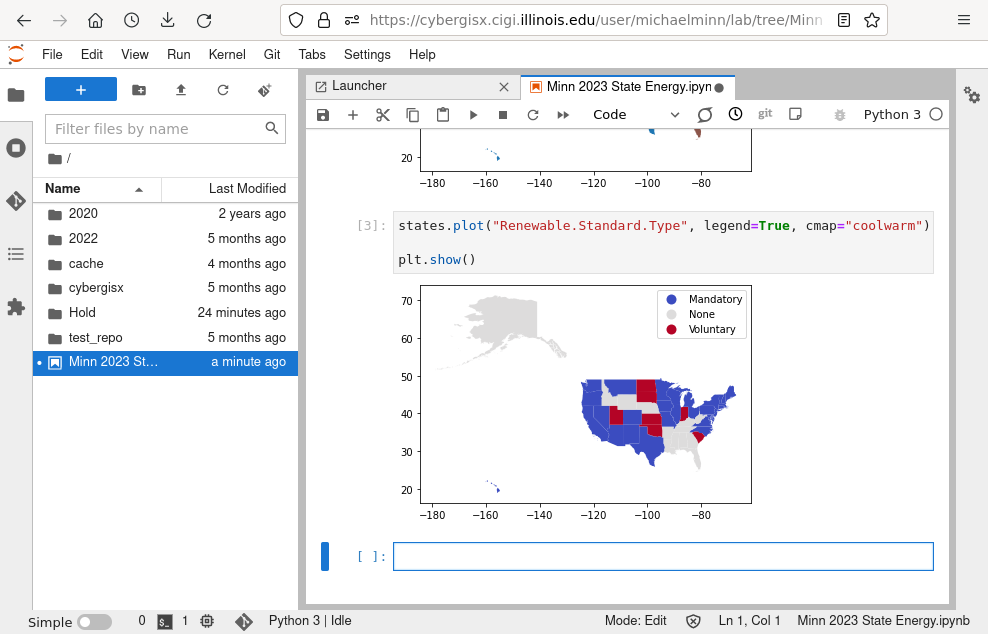
Categorical Color Map
There are a variety of predefined colormaps that you can use to create a map using more descriptive colors by passing the name of the colormap in the cmap parameter on plot()
states.plot("Renewable.Standard.Type", legend=True, cmap="coolwarm")

plt.show()
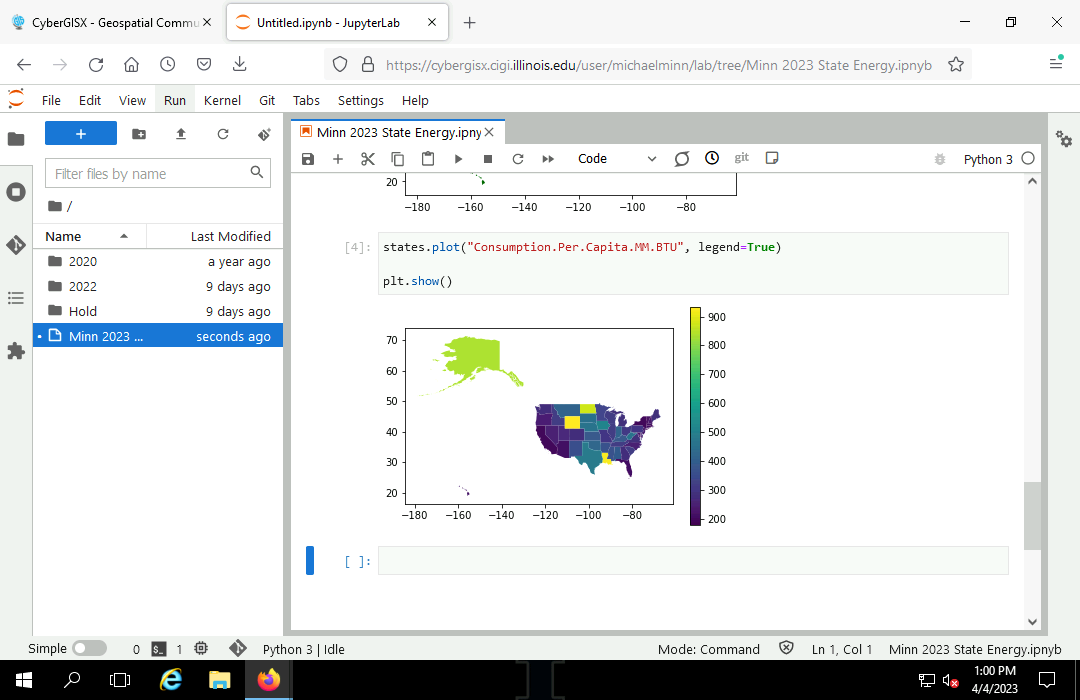
Mapping Quantitative Attributes
The plot() function can also be used to map quantitative attributes, although, again, you may need additional parameters to get what you want.
This creates a map of per-capita energy use in each state in millions of BTUs. The default plot uses a blue-purple-yellow color ramp:
states.plot("Consumption.Per.Capita.MM.BTU", legend=True)

plt.show()
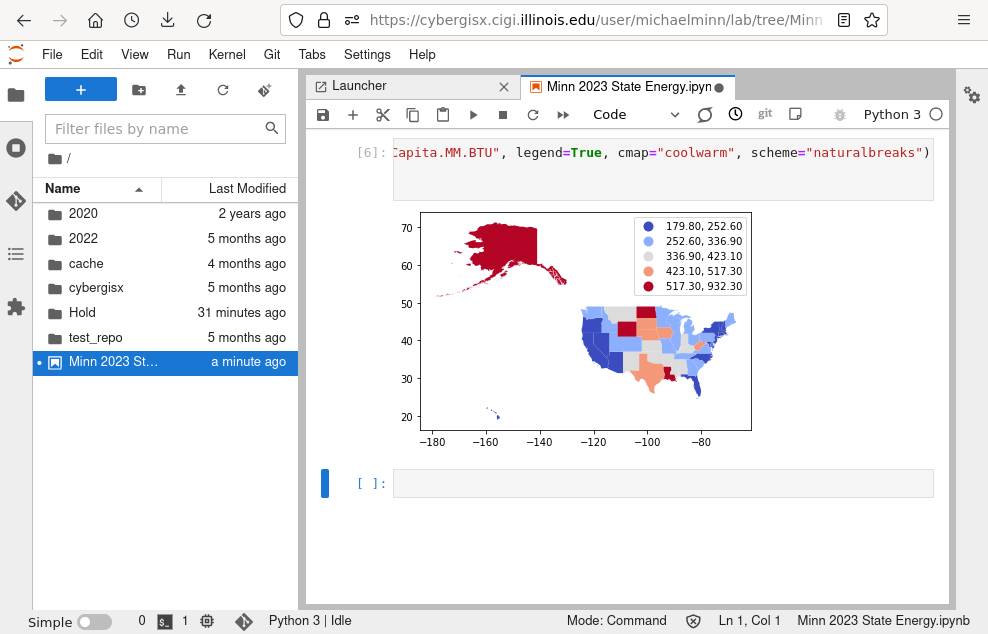
Quantitative Color Map
You can specify a specific colormap with the cmap parameter and use easier-to-read categorized colors by passing the scheme = "naturalbreaks" parameters to plot().
states.plot("Consumption.Per.Capita.MM.BTU", legend=True, cmap="coolwarm_r", scheme="naturalbreaks")

plt.show()
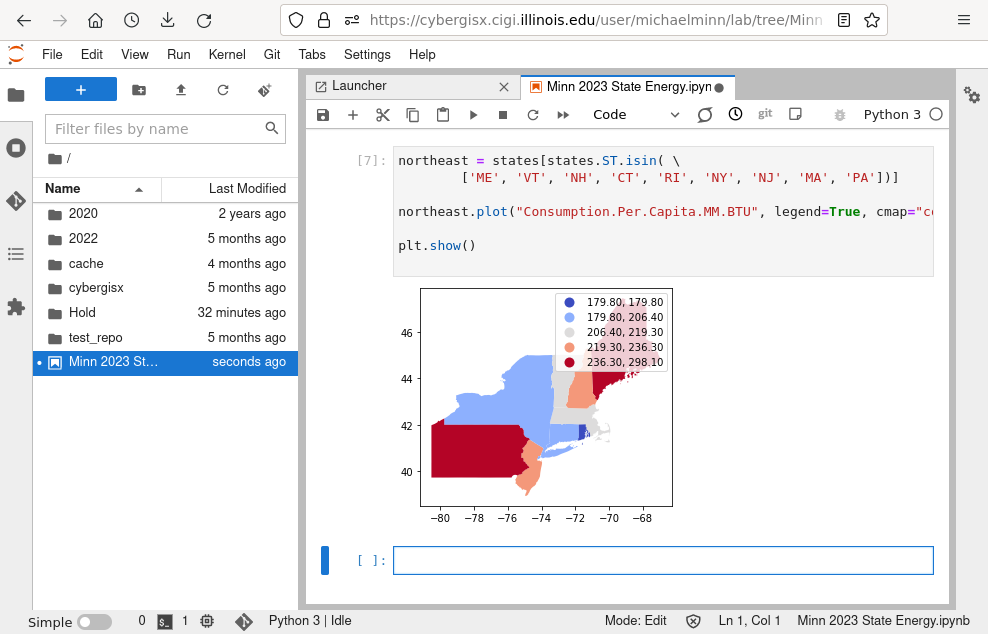
Selection
There will likely be situations where you only want to use a specific selection of features from a geospatial data set.
GeoPandas GeoDataFrame are extensions of Pandas DataFrame, and rows can be selected by attribute using the same techniques used in Pandas
northeast = states[states.ST.isin( \
	['ME', 'VT', 'NH', 'CT', 'RI', 'NY', 'NJ', 'MA', 'PA'])]

northeast.plot("Consumption.Per.Capita.MM.BTU", legend=True, cmap="coolwarm", scheme="naturalbreaks")

plt.show()
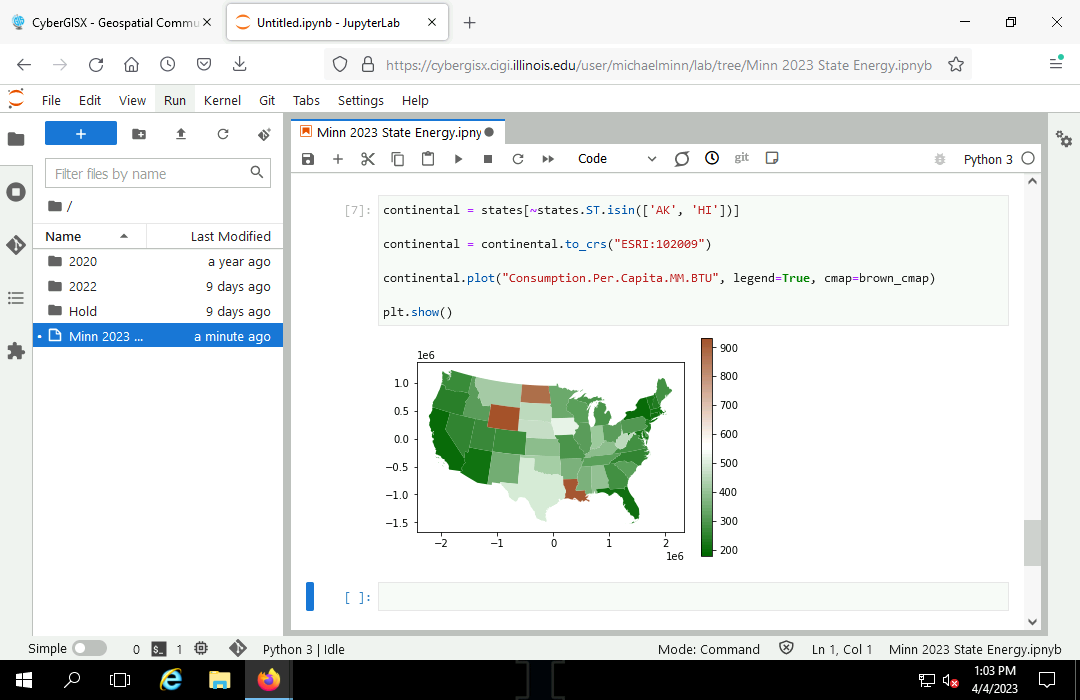
Projections
The Earth exists in three-dimensions but, other than globes, most representations of the earth, such as printed maps or web maps, are two dimensional. A projection is a set of mathematical transformations used to represent the three-dimensional world in two dimensions.
By default, the plot() function plots the geospatial data using an equirectangular projection that may be undesirable depending on what part of the world you are mapping and what you are using the map for.
The to_crs() method can be used to reproject a geospatial object to a new projection. The parameter will accept a EPSG or ESRI WKID or a proj-string that describes the desired projection.
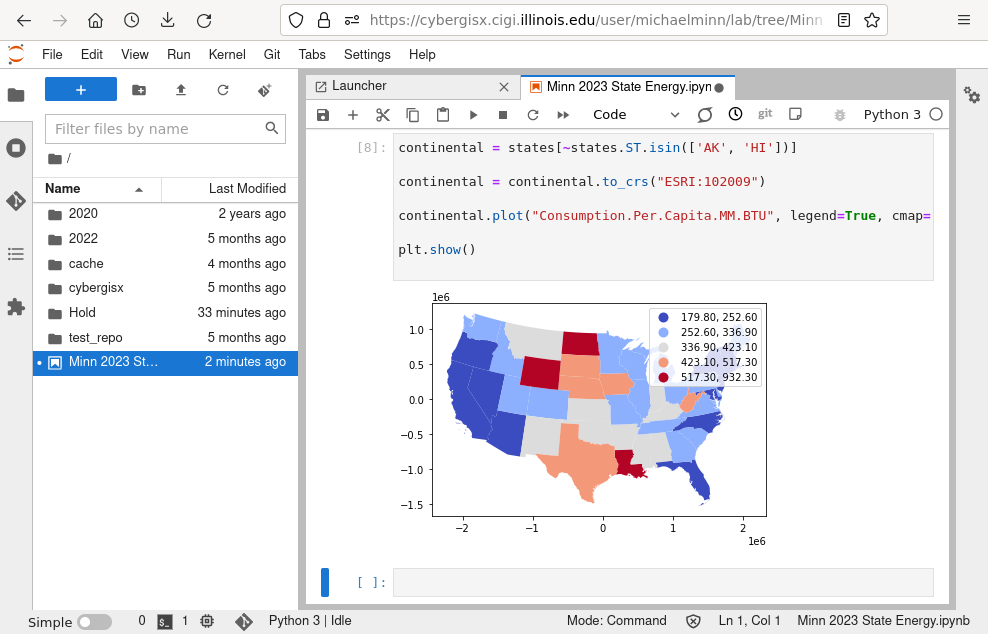
For this map of the US, we use an ESRI WKID for a Lambert conformal conic projection centered on the continental US.
continental = states[~states.ST.isin(['AK', 'HI'])]

continental = continental.to_crs("ESRI:102009")

continental.plot("Consumption.Per.Capita.MM.BTU", legend=True, cmap="coolwarm", scheme="naturalbreaks")

plt.show()
Correlation
The pandas package upon which GeoPandas is built is used for data manipulation and analysis. While there are specialized analysis functions that take advantage of the unique characteristics of spatial data, simple non-spatial functions can be used for data exploration.
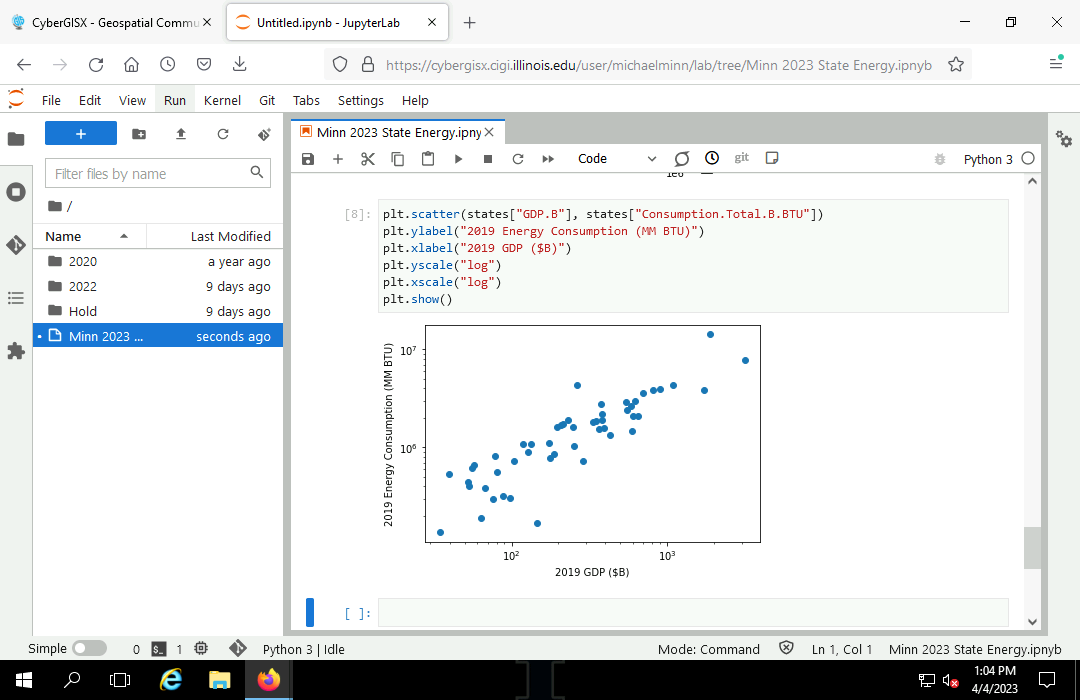
For example, there is a field for gross domestic product (GDP.B), which represents the total amount of economic activity in the state. Greater economic activity is generally associated with higher energy use. To examine whether that is true at the state level, we can plot an X/Y scatter chart between the two attributes to see if the plot shows a correlation.
- For this call to plot(), we pass the two attributes.
- To make small and large states more visible together, we use logarithmic scales for both the x and y axes (yscale and xscale).
- The chart shows a fairly clear line pattern from lower left to bottom right, indicating there is correlation.
plt.scatter(states["GDP.B"], states["Consumption.Total.B.BTU"])
plt.ylabel("2019 Energy Consumption (MM BTU)")
plt.xlabel("2019 GDP ($B)")
plt.yscale("log")
plt.xscale("log")
plt.show()
Linear Model
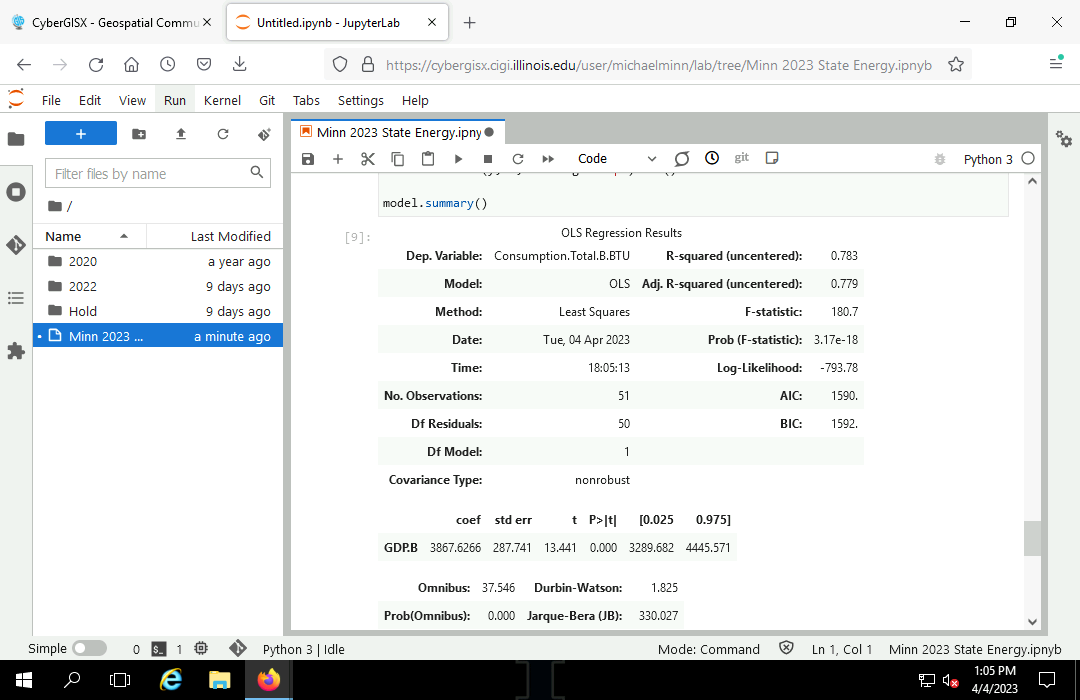
We can use the OLS.fit() method from the statsmodels module to create a simple bivariate linear model for the relationship between GDP and energy consumption.
import statsmodels.api as sm

y = states["Consumption.Total.B.BTU"]

x = states[["GDP.B"]]

model = sm.OLS(y, x, missing="drop").fit()

model.summary()
R2 is a value from zero (no correlation) to one (perfect correlation) and the adjusted R2 value of 0.779 indicates a very strong correlation, as expected.
Regression Line
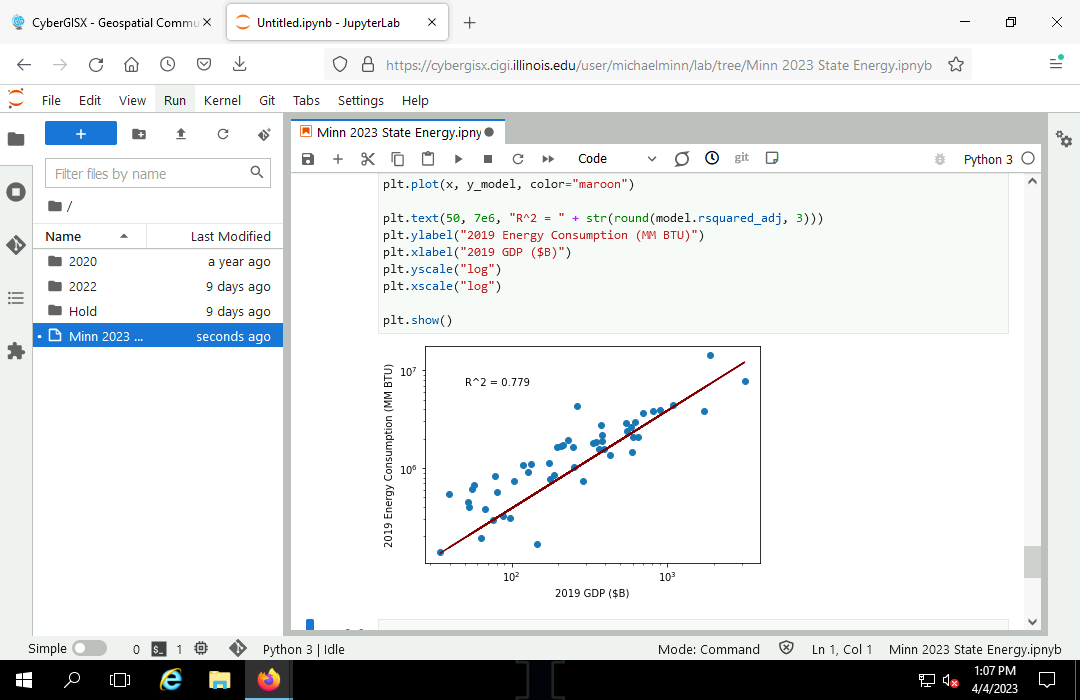
Finally we can plot model predictions as a regression line across the scatter chart.
plt.scatter(states["GDP.B"], states["Consumption.Total.B.BTU"])

y_model = model.predict(x)

plt.plot(x, y_model, color="maroon")

plt.text(50, 7e6, "R^2 = " + str(round(model.rsquared_adj, 3)))
plt.ylabel("2019 Energy Consumption (MM BTU)")
plt.xlabel("2019 GDP ($B)")
plt.yscale("log")
plt.xscale("log")

plt.show()
Sharing
Render
Rendering a notebook is the process of transforming a notebook and the computed results into a format that can be read outside of the Jupyter interface.
Jupyter notebooks are commonly rendered into HTML for viewing in web browsers, or PDF files for printing.
File, Save and Export Notebook As..., HTML
Sharing a Notebook on OneDrive
- Right click on the notebook and Download the notebook to your local storage.
- Upload the file in OneDrive.
- Share with Anyone with the link.
Sharing HTML on OneDrive
- File, Save and Export Notebook As..., HTML
- Upload the file to OneDrive
Sharing with GitHub
GitHub is an internet hosting service for software developers that uses the Git version control software (Wikipedia 2023).
GitHub provides a wide variety of sophisticated features for collaborating on complex software projects, but some easily-accessible features can be useful by users with limited development experience. GitHub is integrated into JupyterHub for sharing notebooks and data.
New Account
You can create a new GitHub account by clicking the Sign in link on the GitHub.com home page and then clicking the Create an account link.

New Repository
Collections of related project files are kept together in GitHub repositories.
- To create a new repository, navigate to the Repositories page and select New.
- Give the repository a meaningful name (cybergisx).
- Click Create repository.
Sharing Notebooks
- Click the Restart the kernel and rerun the whole notebook to make sure the notebook runs from the top and contains graphics.
- Save the notebook to update the file.
- Right click on the notebook and Download.
- Upload the file to GitHub:
- For a new repository, click the uploading an existing file link to upload the file from your local machine.
- For an existing repository, click the Add file button.
- Commit the changes to the repository.
- Click the file to see the file.
- Copy permalink to get a link you can share with others.
Updating Files
To upload a new version of a file:
- Re-run, save, and download your notebook.
- Add file and Upload files using a file with the same name.
- Commit the changed file.
- Git track changes to different versions of the same file, and you can see prior versions of a file in its History page.
Sharing Data Files
If you have a data file that you wish to share so people who have your notebook can access that data through the internet, you can upload it to GitHub and get a shared link to incorporate in your notebook.
- Add file and Upload files with the data file. GitHub will create simple renderings of geospatial data files.
- Copy the shared link from the Download button.
- Incorporate that link in your notebook code.
Appendix: Packages
Python has a wide variety of modules available beyond those that come with a standard Python installation (like math or statistics).
Because there are so many different modules, and because those modules can be interrelated, there is a hierarchy of structures used to manage modules.
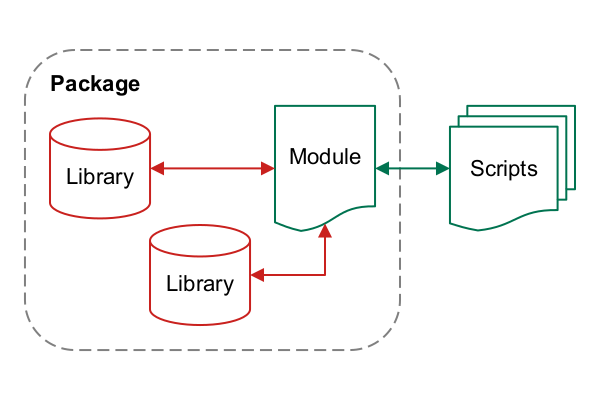
- A module is a set of functions and other objects that you can include in your script.
- A package is collection of related modules distributed and managed as a group.
- A library is a collection of related packages along with operating system files that contain the system code needed by the modules in the packages in the library.
Modules also sometimes provide bindings. Bindings are specialized Python modules containing functions and methods that can be used to call libraries created to be used with other programming languages, usually C or C++.
Repositories are collections of libraries on the internet that are maintained by the Python development team.
You can install packages from repositories using PIP, the package installer for Python.
PIP handles installation of dependencies. Dependencies additional libraries and packages that must also be installed in order to use the modules in a package. Dependencies can get messy and cause confusing installation error messages when they are not carefully configured, or when you are installing a package on a machine with an unusual configuration.
If an import command fails because the module is not installed, you can probably install the needed packages with PIP.
In this example, the numpy module needed by the matplotlib module is not installed and fails when you attempt to import.
Open the Windows Command Prompt and run:
pip import <module_name>
Alternatively, if PIP has not been set up with appropriate environment variables, you can run PIP via Python:
py -m pip install <module_name>