Visualizing Point Clouds in ArcGIS Pro
Rev. 12 November 2025
This tutorial will describe some basic visualizations of point cloud data that can be performed in ArcGIS Pro.
Point Clouds
Point clouds are geospatial information stored as a collection of points that each have three spatial coordinates: latitude, longitude, and elevation.
Point clouds are commonly captured using a aerial laser scanning technique called lidar. Unlike vector and raster data that is analogous to a flat two-dimensional map, point clouds can be used to represent all three dimensions of structures and topography, albeit at the cost of greater storage and processing demands.
Note that the term lidar is used with a variety of capitalizations: lidar, Lidar, LiDAR, LIDAR, LiDar, LiDaR, or liDAR. However, acronyms in common use become common nouns over time and are lowercased (e.g. radar, sonar) (CMS 10.6). Accordingly, this tutorial will follow a common (but not universal) convention of using all lower case letters for lidar (Deering and Stoker 2014).
The traditional digital elevation model is considered a two-point-five dimension surface. At each longitude and latitude, there is exactly one elevation or z value.
If there are layers of features at a location, say a tree planted in the ground, the 2.5 D surface can only represent the top of the tree or the ground underneath the tree. If there is a building, a 2.5D surface can only represent the top of the building or the ground, not each individual floor in the building.
In contrast, a point cloud is a model where there can be multiple points at multiple elevations for each latitude and longitude. A point cloud is true 3-D.
Multiple Returns
Point clouds generated by airborne laser scanners (lidar) can be used to create digital elevation models. However, each pulse of light can be six inches in diameter or wider (Lohani 2010). This means that part of a pulse may reflect off of a high object like a tree leaf or building edge, but other parts of the pulse may continue all the way to the ground before being reflected back to the sensor.
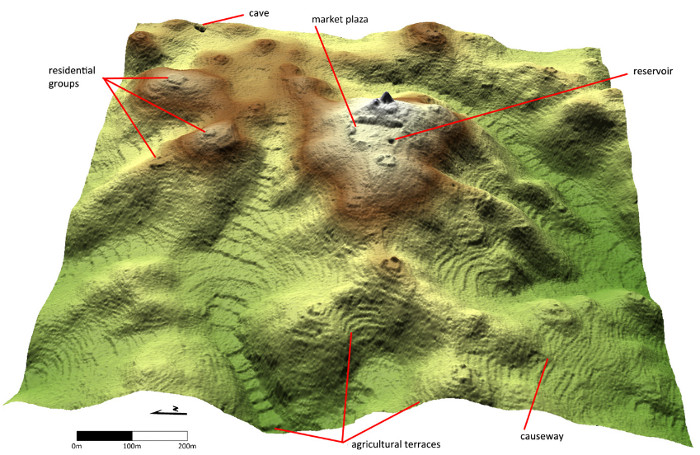
Multiple returns are when a single pulse sent down by the laser return to the sensor multiple times. Multiple returns allow lidar to see through gaps in tree canopies and see features on the ground hidden by vegetation, such as the remains of ancient city earthworks. This has made lidar very useful for archaeological work.
Acquire the Data
Lidar data and digital elevation models for much of the United States are made available to the general public by the US Geological Survey (USGS) via the National Map data download web site.
- Search for a location. For this example we will use the Spokane Falls, a dramatic landscape where the Spokane River passes just north of downtown Spokane, WA.
- Zoom in to the area and select Extent so the search will find all scenes within that mapped area.
- To get point clouds, select Elevation Source Data (3DEP) - Lidar, lfSAR.
- Search Products at that location.
- If the search returns no products, there may be no coverage in that area. Try another area.
- Show the Footprint on the listed products to find the one covering an area you want to explore.
- Download Link (LAZ) the LAZ file which contains compressed point cloud data.
Metadata
Metadata is data about your data.
- You can view the metadata for the point cloud by clicking on the Info/Metadata link in the search results.
- The Start Date will probably be the capture data. Verify this is consistent with the year in the name.
- The Publication Date is the date when the current version was made available on this website. This should also be consistent with the point cloud name.
- Although no lat/long centroid is given in the current version of the metadata, you can get it by showing the footprint and using the XY tool at the bottom of the screen.
Symbolize the Data
Create a Scene
Although you can place point cloud data on a two-dimensional map, the data is much more useful when viewed in three-dimensions. ArcGIS Pro has a type of map called a Scene that allows the user to navigate around three-dimensional data to give different perspectives as if you were flying around the data.
- From the Insert ribbon under the New Map dropdown, select New Local Scene.
- In the scene Properties, give the scene a meaningful name.
- From the Analysis ribbon, open the Tools
and search for the Convert LAS tool.
- For the Input LAS, find the .laz file you downloaded.
- In the Target Folder, navigate to the folder where you want to place the LAS file that will extracted from the LAZ file. LAS. is a standard file type developed in 2003 by the American Society for Photogrammetry and Remote Sensing.
- Under Define Input Coordinate System select No LAS Files. This will use the coordinate system defined in the point cloud file.
- For Output LAS Dataset provide a meaningful name.
- The data may take some time to convert.
- Right click on the point cloud layer in the drawing order pane and select Zoom to Layer.
- If the point cloud is hidden by a gray layer, turn off the Elevation Surfaces.
- If the point cloud stays displayed as a red box, click the refresh button at the bottom left of the screen.
- You can adjust the view by Show Full Control icon at the
bottom left of the scene, and then dragging on the different elements
to change the different angles of view.
- If you get lost in navigation, right click on the point cloud layer in the drawing order pane and select Zoom to Layer.
Point Clouds with No Coordinate System
Some older point cloud files do not contain coordinate system information and will throw an Error 000522 when you try to import them. You will need to figure out what coordinate system is used.
- View the metadata on the USGS website to find the coordinate system (projection) used for the data.
- Search for the <spref> information in the product information XML file.
- While the metadata will likely not specify a projection name or EPSG number, in the US these will usually be a state plane coordinate system.
- In this case, the specification of a transverse Mercator projection, Foot_US (survey feet) linear unit, and North American 1983 HARN datum confirm that this is a state plane coordinate system. The SPCS zone for this area is New Mexico Central.
- Under the scene Properties, Coordinate Systems, switch to the appropriate projection.
- In the Convert LAS tool:
- Under Define Input Coordinate System, select All LAS Files.
- Under Input Coordinate System, use the projection from the Current Scene.
- Uncheck the Rearrange Points option as this can cause the mysterious Error 999999.
- Adjust the view and symbology as needed.
Unsupported Version
The format for LAS files is standardized by the American Society for Photogrammetry and Remote Sensing (ASPRS). The first version 1.0 specification was published in 2003, and, as of this writing, the most recent specification is 1.4 (2019).
If you get error 003583 LAZ versions 1.0 and 1.1 are not supported by the current LAZ encoder/decoder, you will either need to select a different scene or find software that will open LAZ files in legacy formats and convert the file to a current LAZ version.

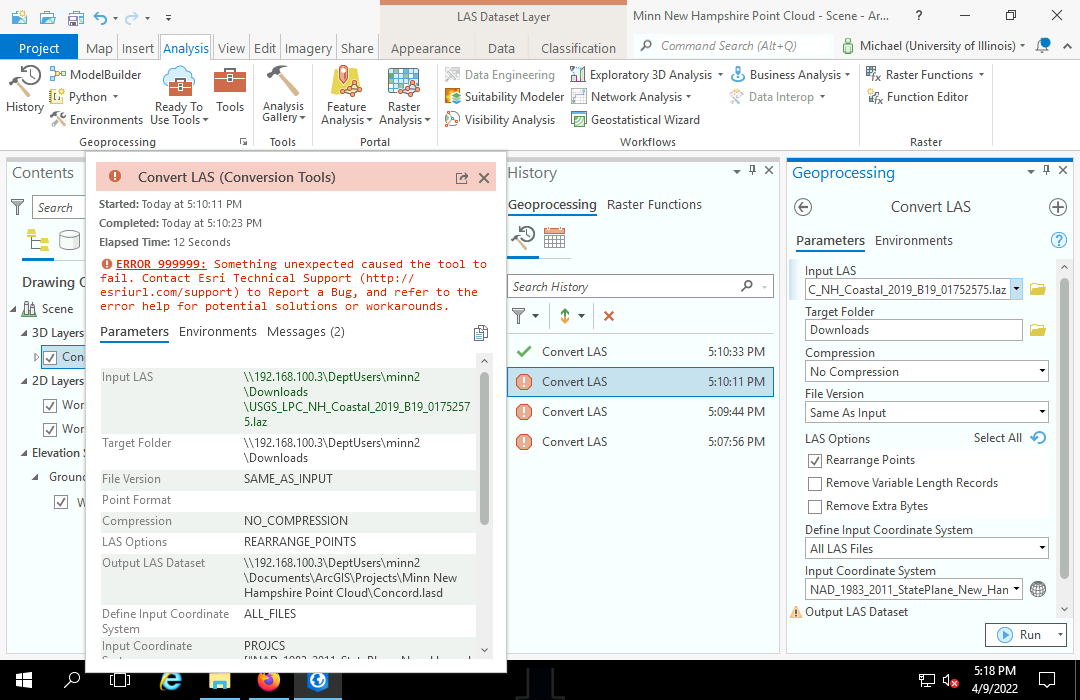
Error 999999
The Convert LAS tool can sometimes fail with the cryptic Error 99999 code that is thrown when the software encounters an unhandled bug.
- This can be caused by unnecessarily defining a coordinate system that is inappropriate for point cloud data files that do contain coordinate system information. This may be solved by selecting an Input Coordinate System of No LAS Files when running the tool.
- This can also be caused by the Rearrange Points feature of the Convert LAS tool. Uncheck the Rearrange Points box to turn off that useful but buggy feature.
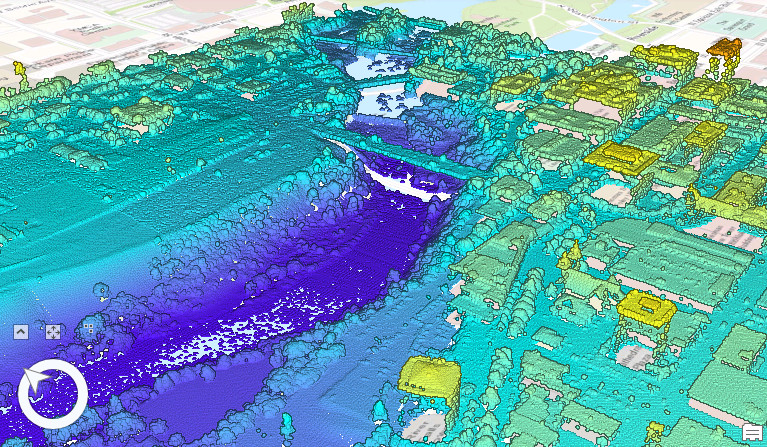
Viewing Different Levels of Returns
One of the strengths of lidar is that the laser can occasionally penetrate the tree canopy or pass in gaps between structures to reveal multiple layers of objects at a single location. This causes the laser signal to return multiple times from a single location. When the lidar data is processed, these returns can be classified to find the different levels of objects in a landscape.
If you right click on a point cloud layer, the LAS Filters option allows you to choose different layers of returns:
- All Points shows everything at all levels.
- Ground shows only the returns that represent the bare ground underneath vegetation or any other objects above the surface.
- Non-Ground is everything above the ground.
- 1st Return is the top level of objects including the tops of vegetation and structures.
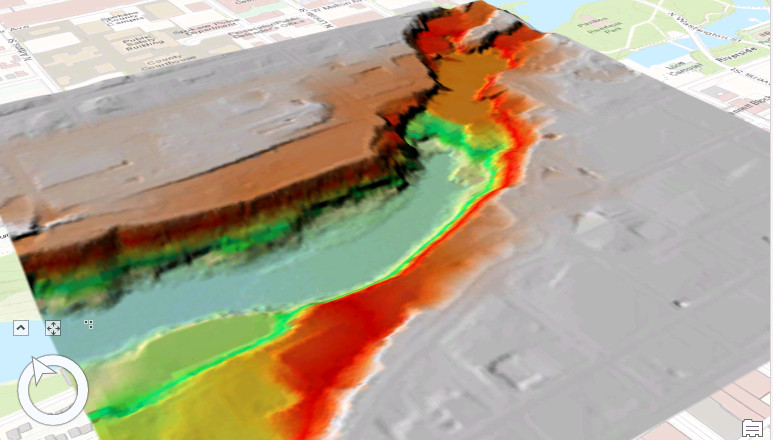
Digital Elevation Model
One common use for lidar point clouds is to create digital elevation model (DEM) surfaces. This can be done using the LAS Dataset to Raster tool.
- Right click on the point cloud and under LAS Filters select Ground points. This will limit the DEM to bare earth.
- In the Analysis tab, select Tools and search for the LAS Dataset to Raster tool.
- For Input LAS Dataset, choose the point cloud layer you want to use.
- For Output Raster, choose a name for the output file.
- In the Imagery tab, under Raster Functions and Surface are a variety of viewing functions that may be appropriate to the topography and/or the use of the map.
Viewing Statistics
You can get accurate statistics about the point cloud using the LAS Dataset Statistics tool.
- In the Analysis tab, select Tools and search for the LAS Dataset Statistics tool.
- The Input LAS Dataset should be your point cloud.
- The Output Statistics Report Text File is the name of the .csv file. Be sure to put a .csv at the end of the file.
- This creates a CSV file that you can open in Excel.
From this we see that the First Returns or the top level of points constitutes the majority of the points (95%).
Because this is an area of both dense structures (downtown) and significant vegetation (Riverside Park), the percentage of Ground points representing bare earth or pavement is fairly small (21.7%).
Present Your Scene
Scenes should be exported directly from the scene rather than through a layout because a bug in layout of scenes causes point clouds to render at low resolution.
- Turn off the elevation and topographic base maps so the service layer credit text doesn't obscure your image.
- Share and Export.
- Export to a PNG file. A portable network graphics (PNG) file is a lossless image format that generally looks good in documents without being too large or causing problems when printing.
- Select the output file Name.
- Select Preview so you can see how the output will be framed.
- Hide the Contents pane so you have the full screen width.
- Adjust the Width and Height to the size of the figure. At 300 DPI, a 6 x 4" figure should be 1800 x 1200 pixels.
- Export a PNG and insert that image file into your document.
Save Your Project
Upload to ArcGIS Online
You should save your project as a project package to ArcGIS Online so you can open the project on another machine, and so you have a backup.
- You may want to rename your maps and layouts to keep them organized. You can do this from View and Catalog Pane.
- Go to the Share tab and select Project.
- Provide a name to save the project under. The default is the name of the current project.
- Copy the name into the Tags and Summary fields.
- Click the Share outside of organization box so your project database containing your layers is included in your project package.
- Unclick the Include Toolboxes and Include History Items check boxes so that history or toolbox errors to not cause your upload to fail.
- Analyze the project to find any problems.
- Package the project to upload it to ArcGIS Online. With large point clouds, this can take several minutes.
Reopen Your Project
You can reopen your project from the ArcGIS Pro home screen by going to Open another project, navigating to My Content and selecting the project package you uploaded.
When you reopen your project, the LAS layer may have an exclamation mark beside it indicating that the layer cannot be found.
- Presuming that you saved the project with Share outside of organization checked, the LAS data will be downloaded, but ArcGIS Pro may not know where to find it.
- Right click on the layer and select Properties, Source, and Set Data Source.
- Navigate through the Folders to commondata and you should find the LAS file somewhere in there.
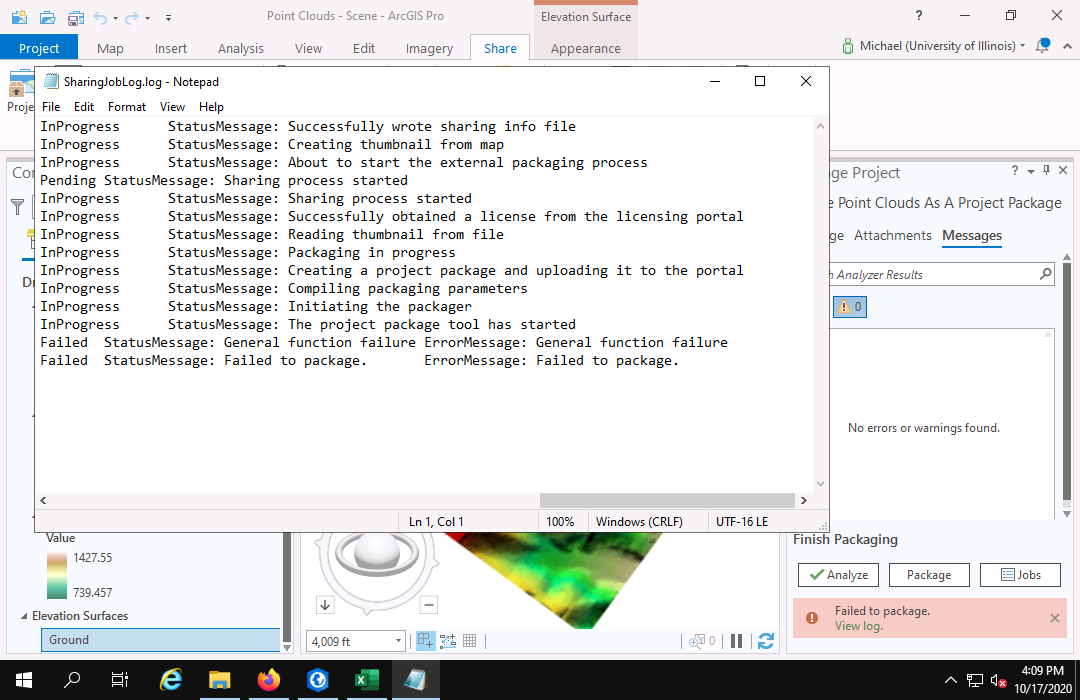
General Failure Workaround
Projects containing point clouds and DEMs are large, which appears to cause ArcGIS Pro to die with a cryptic General Function Failure message when uploading project packages to ArcGIS Online.
A workaround is to use the Project Project tool and Save package to file, then upload that package to ArcGIS Online.