The Geography of Chinese Restaurants in New York City, 2009
In late 2009, around 2,300 of New York City's 22,000 restaurants were Chinese restaurants. These restaurants were remarkably well distributed over the five boroughs with a seeming absence of any regard for the underlying economic, ethnic or political demographics of the neighborhoods they serve. The fairly narrow range of prices across the city provides an economical dining option for almost all city residents and hints that Chinese restaurants may have reached a point of market saturation in New York City. The ubiquity of Chinese restaurants across the city and across the nation indicates that Chinese food has shed much of its "ethnic" identity to become a native American cuisine.
This collection of photos originally began as a project in a Geographic Information Systems (GIS) class at Hunter College and explored the question of where there were any large-grained spatial patterns that could be observed in the location of the city's Chinese restaurants. A list of all restaurants was downloaded from the New York City Department of Health (NYCDOH) Restaurant Inspection Information website.
The list was filtered by restaurant name with the following criteria:
- Geographic reference to China or some region of China like Szechuan, Hunan, etc.
- Common Chinese names like Wong, Yee, etc.
- Chinese iconography like Great Wall, Wok, etc.
- Idiosyncratic Chinese restaurant names like Good Friend, Number One, etc.
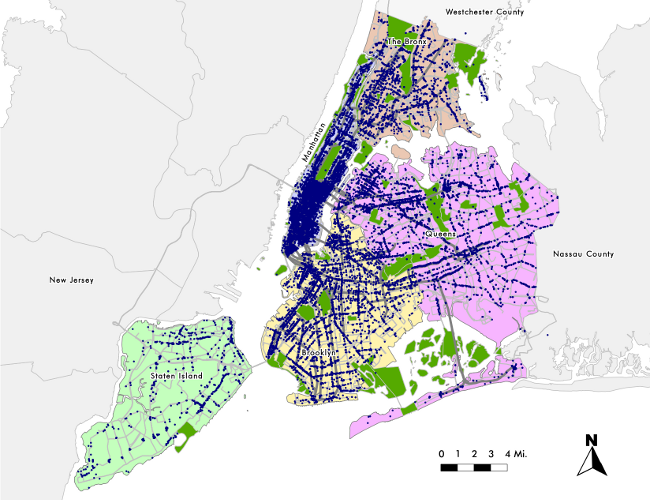
The result was a list of restaurants that is mapped below. The density of restaurants largely mirrors the density of restaurants in general, with notable clusters in the Chinatowns of Lower Manhattan, Flushing, Queens, and Sunset Park, Brooklyn.
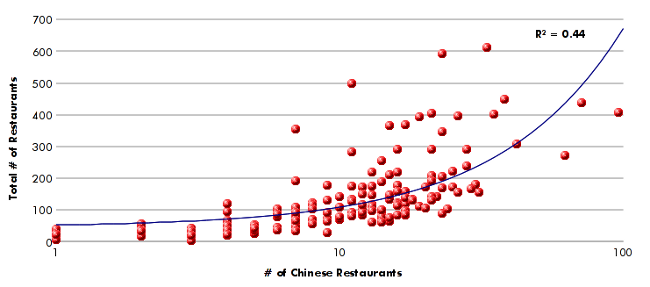
Spatially correlating the density of these restaurants with neighborhood demographics from the 2000 Census revealed few meaningful relationships. As might be expected, there was a slight relationship between population and restaurant density - the more people in a neighborhood, the more Chinese restaurants there are. And there was a fairly strong correlation with the density of all types of restaurants - where there are more restaurants, there are more Chinese restaurants.
Since restaurant information was obtained from the NYCDOH website, inspection information was also available. Immigrant groups, and Chinese in particular, have historically been considered exotic, mysterious, or unsanitary. There are references in the NY Times in the late 19th century to concerns that the Chinese ate rats and were feeding them to unsuspecting Caucasian patrons.
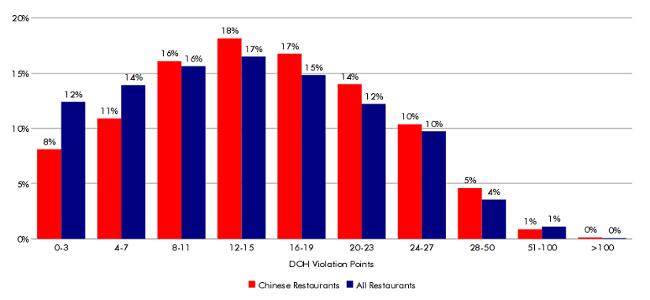
The NYCDOH restaurant inspection scores for Chinese restaurants are almost identical to restaurants as a whole. Inspection points are lost for violations, so lower scores are better. Scores of 28 and above require immediate remediation and may result in closure. The average score for NYC's Chinese restaurants was around 15.7, compared to 14.4 for all restaurants. 94% of Chinese restaurants were in compliance (score of less than 28) compared to 95% of all restaurants. Although some Chinese restaurants can be quite fearsome looking, on average they are no dirtier than restaurants in general.
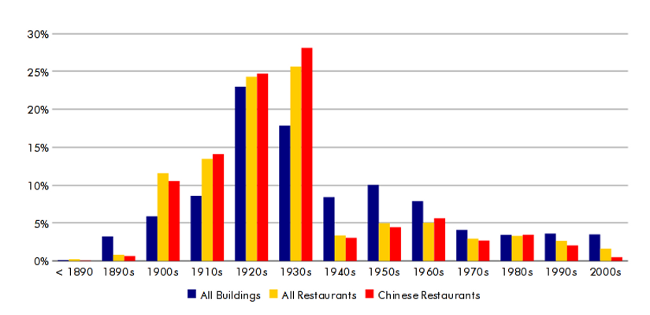
In her classic text The Death and Life of Great American Cities, Jane Jacobs asserts that successful neighborhoods must, "mingle buildings that vary in age and condition, including a good proportion of old ones." This observation is not based on sentimental or architectural considerations, but because, "hundreds of ordinary enterprises, necessary to the safety and public life of streets and neighborhoods, and appreciated for their convenience and personal quality, can make out suc- cessfully in old buildings, but are inexorably slain by the high overhead of new construction."
If this assertion is true, we might expect Chinese restaurants to favor older buildings. And in joining restaurant addresses with the city's PLUTO property tax lot data, Chinese restaurants, like restaurants in general tended to favor pre-WW-II buildings, as is indicated in the graph below:
Field Work
Field work was used to validate the data and get additional insight on the city's Chinese restaurants.
Preliminary convenience samples were taken in Central Brooklyn, the South Bronx, Manhattan's Upper West Side, Staten Island and Flushing Queens. During these trips, menus and photos were collected from limited geographic areas.
A random sample of 110 restaurants from all five boroughs was taken from the list of 2,300 restaurants. Each of these restaurants was visited in the last week of 2009. This made it possible to analyze citywide pricing data and restaurant typology.
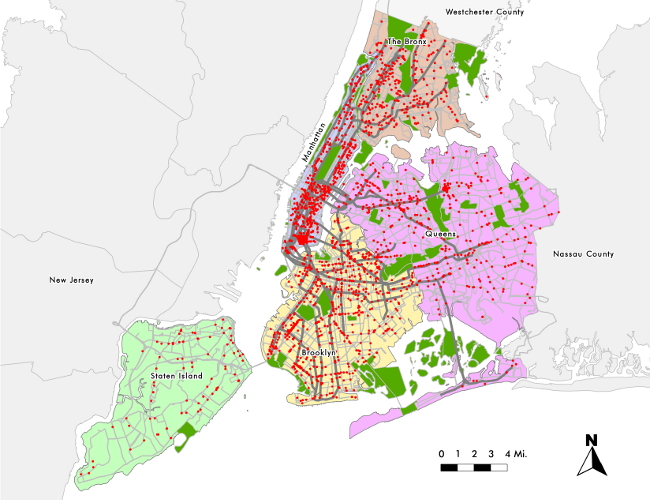
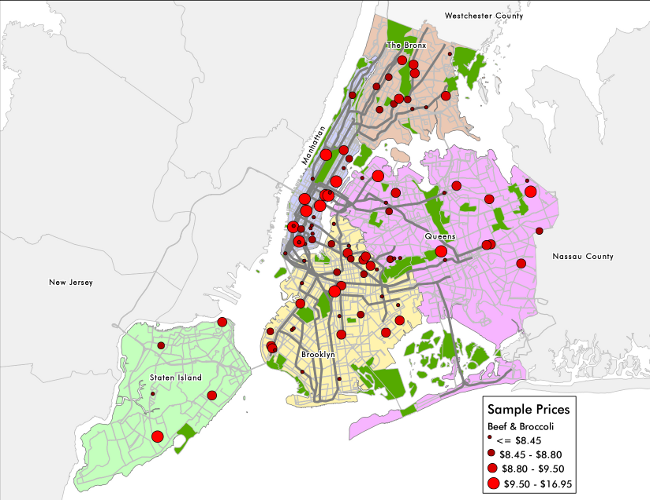
The benchmark for pricing was a large portion of beef and broccoli and the price data from the random sample is mapped below. Most prices were between $7.50 and $10.50, with a handful of high-end restaurants up to $16.50. The narrow range of prices implies a commodification of Chinese food that may also reflect market saturation.
Although Manhattan shows a concentration of higher-priced restaurants and the less affluent South Bronx shows few higher-priced restaurants, there is no clear, absolute geographic pattern that emerges. This indicates that there are significant microeconomic and/or social forces at work which would require a more fine-grained exploration to derive meaninful conclusions.
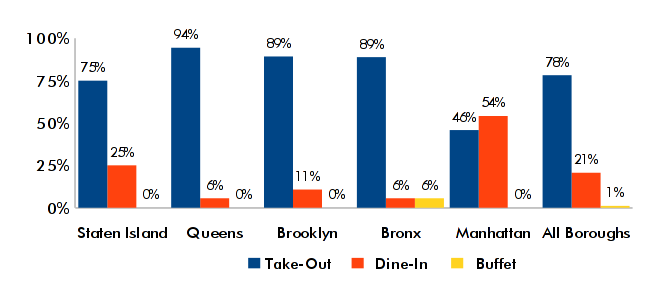
New York's Chinese restaurants can be grouped into three basic categories: take-out, dine-in and buffet. Take-out restaurants have few, if any, tables and are oriented toward delivery or take-out. Dine-in restaurants have tables and waiter service. Buffets provide food on steam tables for all-you-can eat self service.
The graph below shows the dominance of the take-out in the city's Chinese restaurants. However, the small number of buffets is surprising given the dominance of that restaurant type in much of the rest of the country. Again, microeconomic and social factors like high rents and a more difficult patron base are likely involved.