Tract NDVI Models
Michael Minn - 30 April 2015
Variables
Landsat Data
NDVI: Median tract residential area NDVI
Census Data
SQMLAND: Tract area in square meters
MEDIANAGE: Median age
MEDHHINC: Median household income
MEANHHSIZE: Mean number of members in each household
PCOWNEROCC: Percent housing units owner-occupied
PCTURNOVER: Percent residents in same house one year ago
PCBORNUSA: Percent of residents born in the USA
PCUNEMPLOYED: Percent 16 years of age or older unemployed (mean?)
Parcel Data
Data from 2013 Maricopa County Assessor's Office ST 42030 File
SQMLAWN: Total square meters of PLA (lot_size - (home_size / floors) - pool_size)
MEDCONSTYR: Median construction year
Climate Data
P_MINUS_PET: Precipitation - potential evapotranspiration
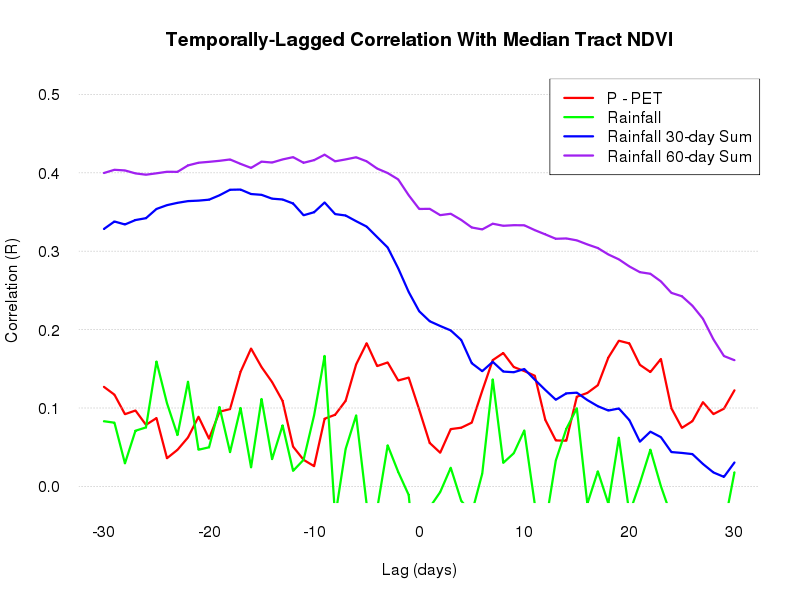
RAINFALL60: Running sum of rainfall for the past 60 days
A temporally-lagged running sum of rainfall has the highest correlation with tract NDVI.
A five-day lag between P_MINUS_PET and NDVI gives best correlation r = 0.18
A nine-day lag between 60-day Rainfall sum and NDVI gives best correlation r = 0.423
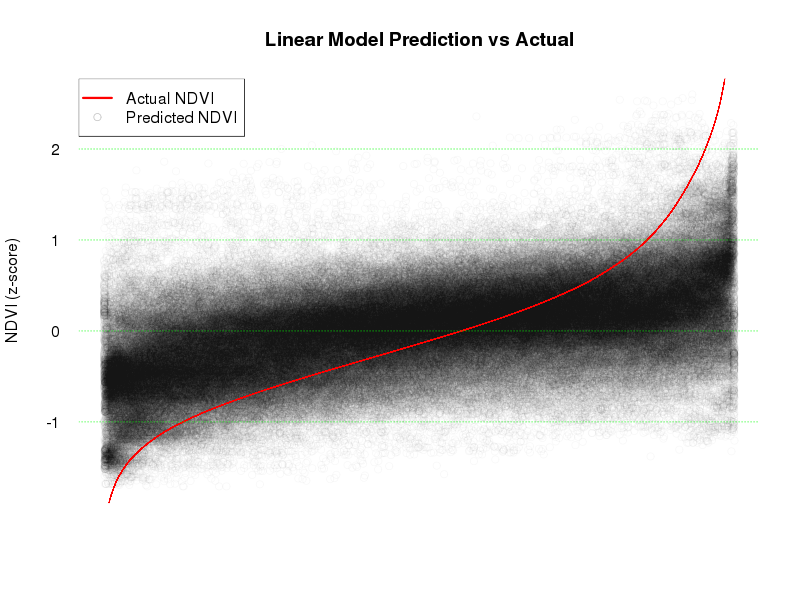
Linear Model
Call:
lm(formula = NDVI ~ ., data = regression_data)

Residuals:
    Min      1Q  Median      3Q     Max
-4.2980 -0.5458 -0.1283  0.3942 13.0695

Coefficients:
              Estimate Std. Error  t value Pr(>|t|)
(Intercept)   0.009428   0.001658    5.687  1.3e-08 ***
SQMLAND      -0.017284   0.001708  -10.117  < 2e-16 ***
MEDIANAGE    -0.334194   0.002522 -132.535  < 2e-16 ***
MEDHHINC      0.320085   0.002271  140.941  < 2e-16 ***
MEANHHSIZE   -0.246225   0.002517  -97.832  < 2e-16 ***
PCOWNEROCC    0.018373   0.002167    8.479  < 2e-16 ***
PCTURNOVER    0.113816   0.002150   52.944  < 2e-16 ***
PCBORNUSA     0.095260   0.002555   37.286  < 2e-16 ***
PCUNEMPLOYED -0.070619   0.002257  -31.295  < 2e-16 ***
SQMLAWN       0.081585   0.001991   40.984  < 2e-16 ***
MEDCONSTYR   -0.479292   0.002037 -235.245  < 2e-16 ***
RAINFALL60    0.136666   0.001585   86.234  < 2e-16 ***
---
Signif. codes:  0 '***' 0.001 '**' 0.01 '*' 0.05 '.' 0.1 ' ' 1

Residual standard error: 0.8769 on 293032 degrees of freedom
  (160337 observations deleted due to missingness)
Multiple R-squared:  0.2538,    Adjusted R-squared:  0.2538
F-statistic:  9060 on 11 and 293032 DF,  p-value: < 2.2e-16
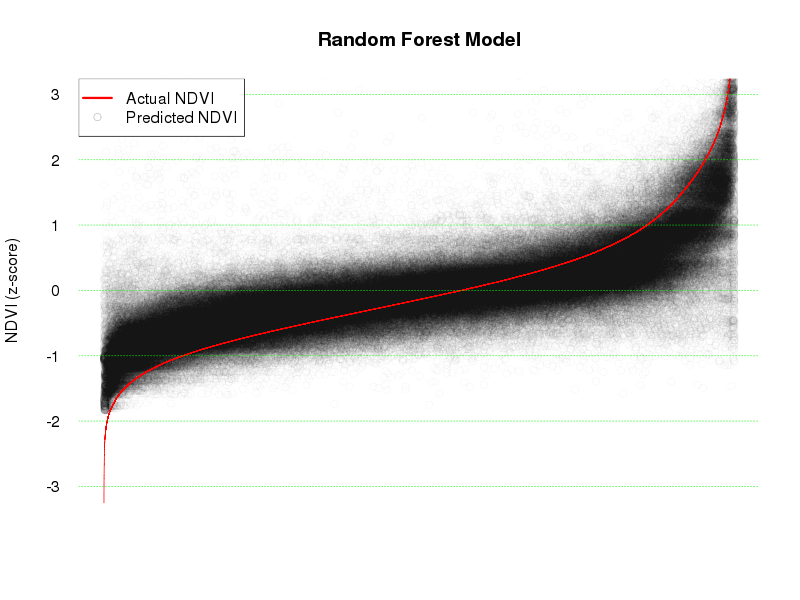
Random Forest Model
> model

Call:
 randomForest(formula = NDVI ~ ., data = database[, rfields],      na.action = na.omit)
               Type of random forest: regression
                     Number of trees: 500
No. of variables tried at each split: 4

          Mean of squared residuals: 0.2130862
                    % Var explained: 78.88


> summary(model)
                Length Class  Mode
call                 4 -none- call
type                 1 -none- character
predicted       301211 -none- numeric
mse                500 -none- numeric
rsq                500 -none- numeric
oob.times       301211 -none- numeric
importance          12 -none- numeric
importanceSD         0 -none- NULL
localImportance      0 -none- NULL
proximity            0 -none- NULL
ntree                1 -none- numeric
mtry                 1 -none- numeric
forest              11 -none- list
coefs                0 -none- NULL
y               301211 -none- numeric
test                 0 -none- NULL
inbag                0 -none- NULL
terms                3 terms  call
na.action       152170 omit   numeric


> importance(model)
             IncNodePurity
SQMLAND          22156.939
SQMWATER          8838.317
MEDIANAGE        24688.405
MEDHHINC         26790.211
MEANHHSIZE       23293.283
PCOWNEROCC       13776.804
PCTURNOVER       13744.089
PCBORNUSA        13494.287
PCUNEMPLOYED      9865.677
SQMLAWN          31388.236
MEDCONSTYR       54570.323
PMINPET          12390.099
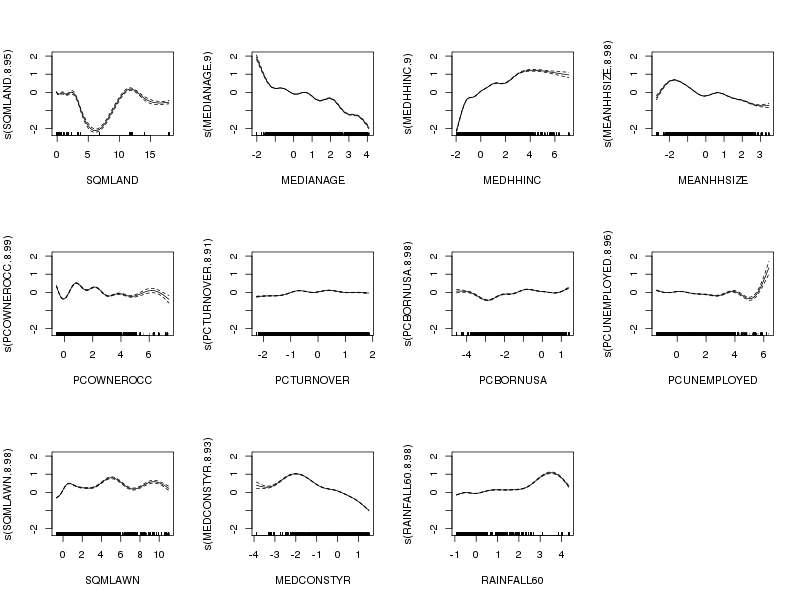
Generalized Additive Model
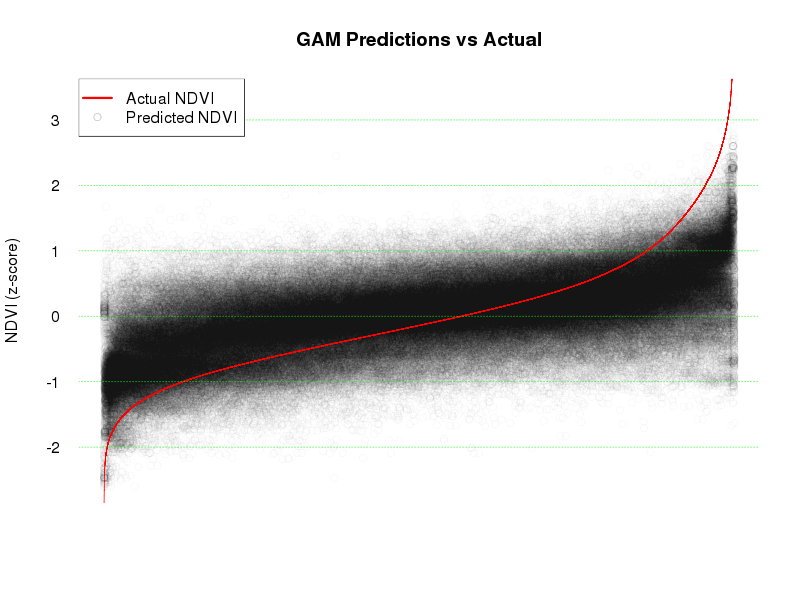
summary(gamodel)

Family: gaussian
Link function: identity

Formula:
NDVI ~ s(SQMLAND) + s(MEDIANAGE) + s(MEDHHINC) + s(MEANHHSIZE) +
    s(PCOWNEROCC) + s(PCTURNOVER) + s(PCBORNUSA) + s(PCUNEMPLOYED) +
    s(SQMLAWN) + s(MEDCONSTYR) + s(RAINFALL60)

Parametric coefficients:
            Estimate Std. Error t value Pr(>|t|)
(Intercept) 0.004502   0.001493   3.016  0.00256 **
---
Signif. codes:  0 '***' 0.001 '**' 0.01 '*' 0.05 '.' 0.1 ' ' 1


Approximate significance of smooth terms:
                  edf Ref.df       F p-value
s(SQMLAND)      8.952  8.999  337.97  <2e-16 ***
s(MEDIANAGE)    8.999  9.000 1375.92  <2e-16 ***
s(MEDHHINC)     8.995  9.000 2272.24  <2e-16 ***
s(MEANHHSIZE)   8.975  9.000 1308.43  <2e-16 ***
s(PCOWNEROCC)   8.990  9.000  473.22  <2e-16 ***
s(PCTURNOVER)   8.911  8.998  246.44  <2e-16 ***
s(PCBORNUSA)    8.982  9.000  334.18  <2e-16 ***
s(PCUNEMPLOYED) 8.958  8.999   97.41  <2e-16 ***
s(SQMLAWN)      8.985  9.000 1296.71  <2e-16 ***
s(MEDCONSTYR)   8.932  8.998 5495.54  <2e-16 ***
s(RAINFALL60)   8.976  9.000 1098.06  <2e-16 ***
---
Signif. codes:  0 '***' 0.001 '**' 0.01 '*' 0.05 '.' 0.1 ' ' 1

R-sq.(adj) =  0.366   Deviance explained = 36.7%
GCV = 0.65316  Scale est. = 0.65294   n = 293044