Survey Vacancy Analysis
Michael Minn - 4 March 2015
This is a summative report on my analysis of your 4/1/2009 returned surveys as a natural experiment in detection of a foreclosure/vacancy relationship. The data we have available supports the assumption that there is a positive relationship between foreclosure and vacancy. However, limitations on the quality and granularity of that data severely limit the amount of meaningful generalization that can be inferred about that relationship, as well as the rigor to which such generalization could be defended. Accordingly, I do not recommend dedication of further effort to this particular line of inquiry unless additional effort (and expense) are dedicated to acquiring more-robust data.
Overview
Below is a graphical summary of the statistics on the 3,600 parcels from the survey, which was administered around 1 April 2009.
- Undeliverable are surveys that were returned undelivered for any reason.
- Vacant are surveys that were returned with a marking that the residence was vacant.
- Foreclosed are parcels that were sold at a foreclosure auction held within one year prior to or after the survey date.
- Pending Sale is the number of parcels on 1 April 2009 that were between the foreclosure auction and the subsequent sale to the next owner.
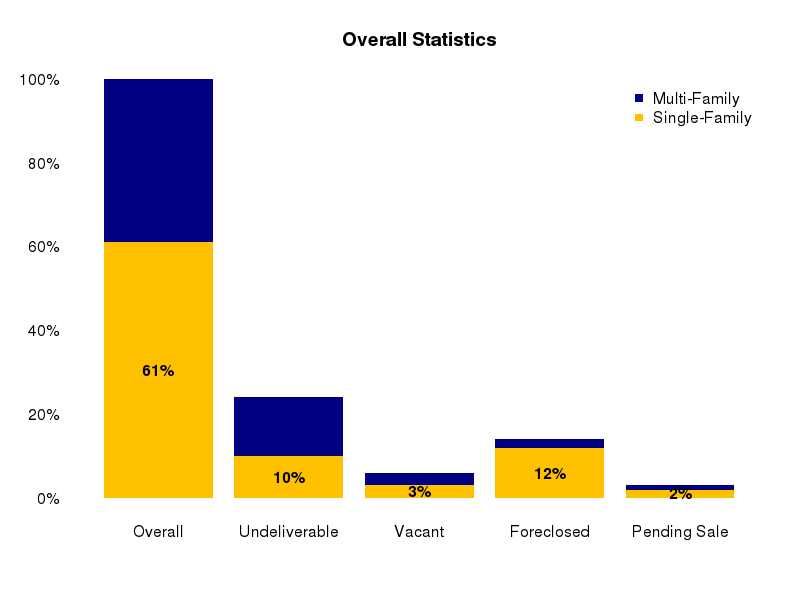
These rates do not give a clear indication that undeliverability was dramatically increased as a result of the high number of foreclosures occurring during the survey administration period. The 24% undeliverable rate is a bit high, although it is not out of the ballpark for comparable anecdotal statistics. The 4.8% vacancy rate is also slightly under comparable statistics and USPS data for Maricopa County.
- A survey of fishermen in Alaska had a 21% undeliverable rate.
- A 2006 survey of Penn State alumni had a 18% undeliverable rate.
- Jury summonses have a 12% undeliverable rate, consistent with the 2007 national migration rate of 17%
- The 2012-2013 mover rate = 11.7%
- 8% of all mail is undeliverable
- The 2013 rental vacancy rate was 8.3% nationally and 6.2% in the West. The 2013 homeowner vacancy rate was 2.0% nationally and 1.6% in the West.
Coincidence of Foreclosure and Undeliverability
The graph below displays the shares of undeliverable / vacant addresses coinciding with foreclosure / pending-sale:
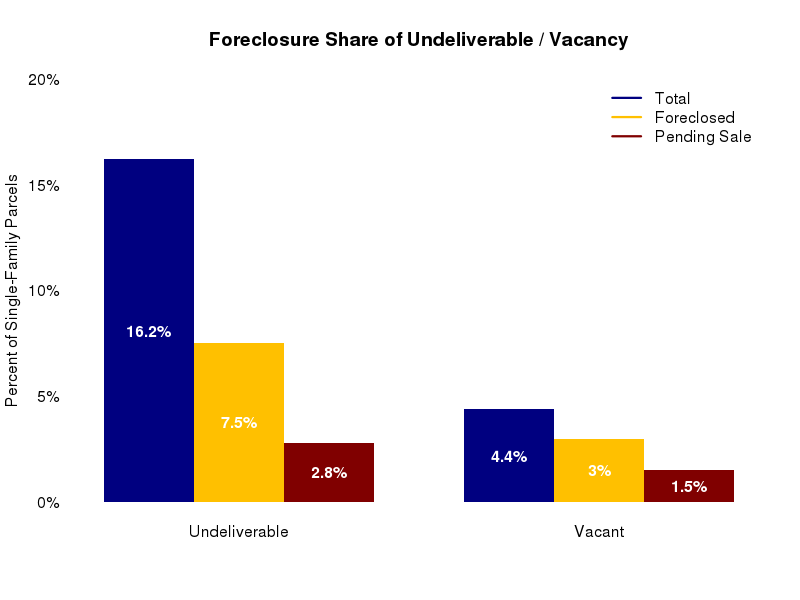
Almost half of the surveys returned undeliverable and two-thirds of the surveys returned vacant had a recent or impending foreclosure. The contingency tables given below show that both foreclosure and pending post-foreclosure sale increase the probability of being undeliverable or vacant. The p-values for chi-squared tests are low, indicating that the null hypothesis of independence between these variables should be rejected.
However, without longitudinal data, it is not possible to infer whether these relationships are constant over time or are specific to this particular moment in the housing bust within this limited set of census tracts.
                Foreclosed Unforeclosed
  Deliverable          252         1587
  Undeliverable        165          190

                Awaiting Sale Unforeclosed
  Deliverable              19         1820
  Undeliverable            62          293

           Foreclosed Unforeclosed
  Occupied        351         1747
  Vacant           66           30

           Awaiting Sale Unforeclosed
  Occupied            48         2050
  Vacant              33           63
Correlation with ACS and USPS Vacancy Rates
The availability of vacancy data at the census tract level from the American Community Survey (ACS) and from The United States Postal Service presented the possibility of using that data along with foreclosure data to build a model for foreclosure-related vacancy. However, data from neither source exhibited strong correlation with the survey undeliverable/vacant data from the (admittedly) limited number of tracts.
Note that ACS and USPS data in 2009 are not directly comparable because the ACS used 2000 census tract boundaries while the currently-released USPS data uses 2010 census tract boundaries.
As shown in the graph below, there is a clear parallelism to the curves of foreclosed parcels awaiting sale in Maricopa County and overall residential vacancy rates reported by the USPS.
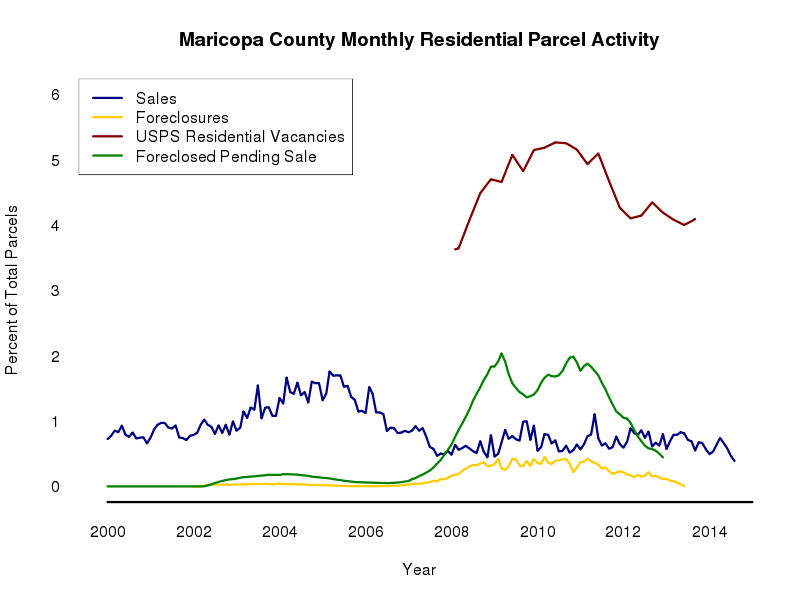
However, this possible aggregate relationship between vacancy and foreclosure could not be clearly traced at the tract level, with different tracts exhibiting widely varying levels of correlation between foreclosure/pre-sale and USPS reported residential vacancy. The absence of a direct relationship between county-level and tract-level vacancy could be related to deficiencies in the data and/or could be attributable to the temporal and spatial sparsity of foreclosure events.
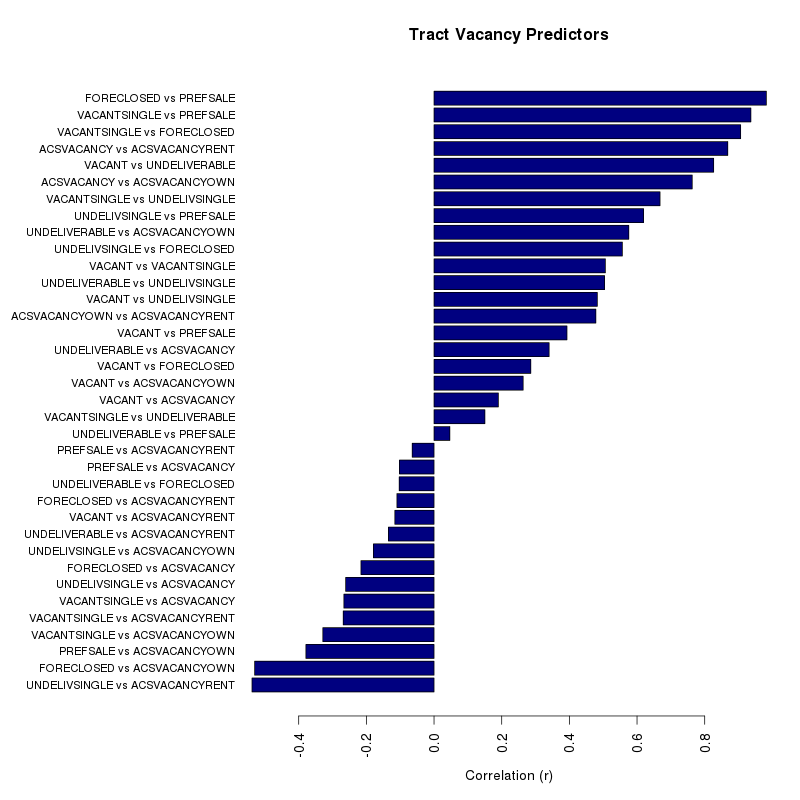
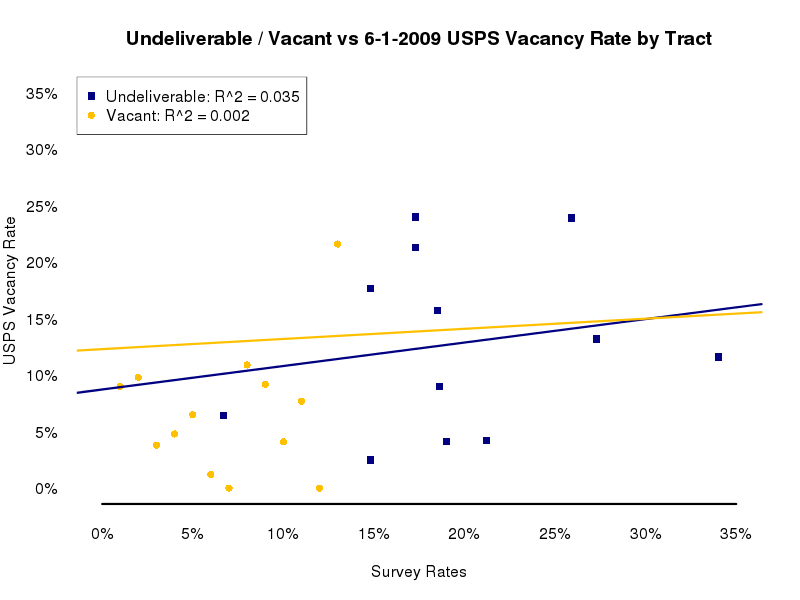
The correlation between survey undeliverability/vacancy data and USPS vacancy rates at the tract level was also weak, as shown in the graph below. This absence of correlation may be, in part, attributable to the limited number of census tracts represented by the survey addresses as well as serious weaknesses in the USPS data prior to the implementation of a more-consistent methodology in 2010.
Undeliverability / Vacancy and NDVI
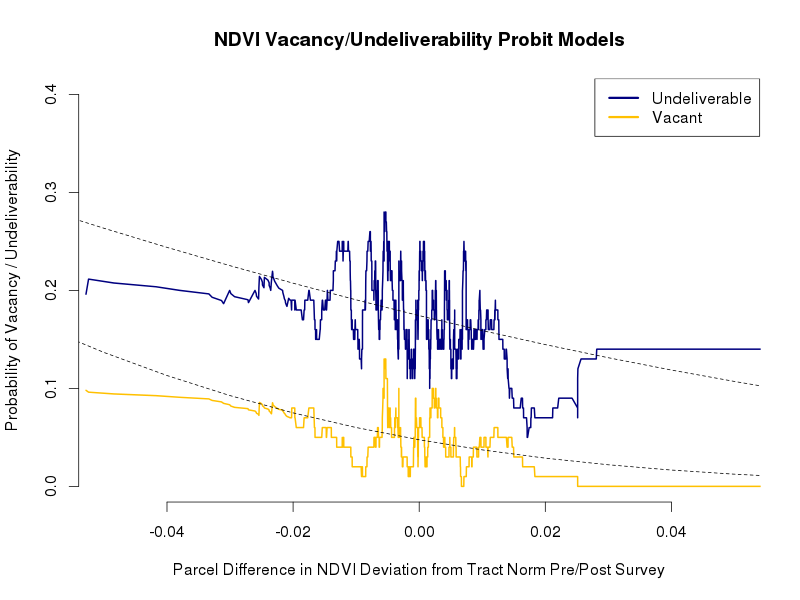
Finally, probit models were run between single-family parcel-level NDVI difference in deviation and undeliverability/vacancy. The graph below displays a running-mean of 0/1 truth values for undeliverability/vacancy along with fitted probit models. As with foreclosure, the models are of questionable strength, although the undeliverability model appears to be stronger than the vacancy model (AIC 751 for undeliverability vs 1865 for vacancy)
Literature Review
At the height of the crisis, Shilling (2009, 108) noted that "there is little, if any, research that explores the relationships between the number and length of time that homes in the foreclosure process become vacant..." Shilling (2009, 109) also asserts that, "Creation of a new model that can track and inventory when foreclosed properties become vacant would be particularly useful...Correlating vacancy with foreclosure is essential for future federal and state assistance to communities, especially for its code enforcement operations."
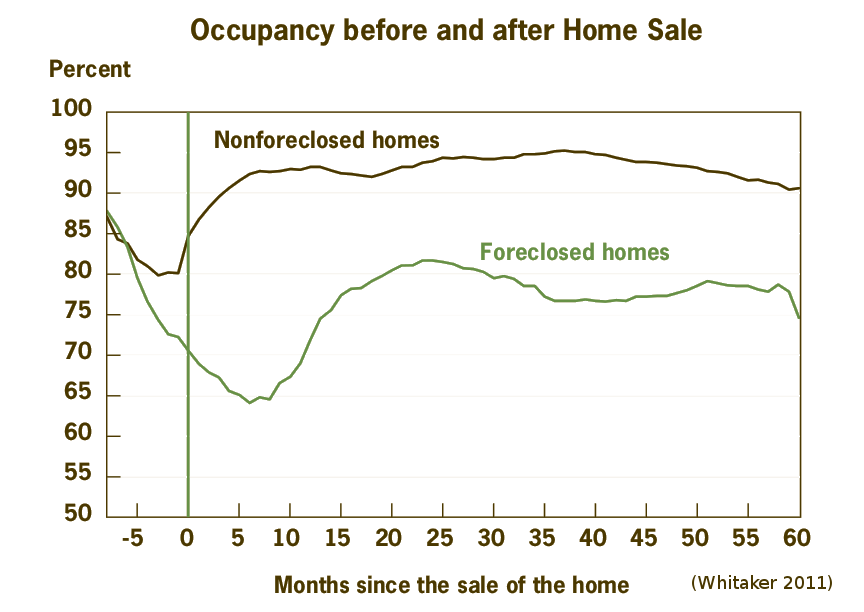
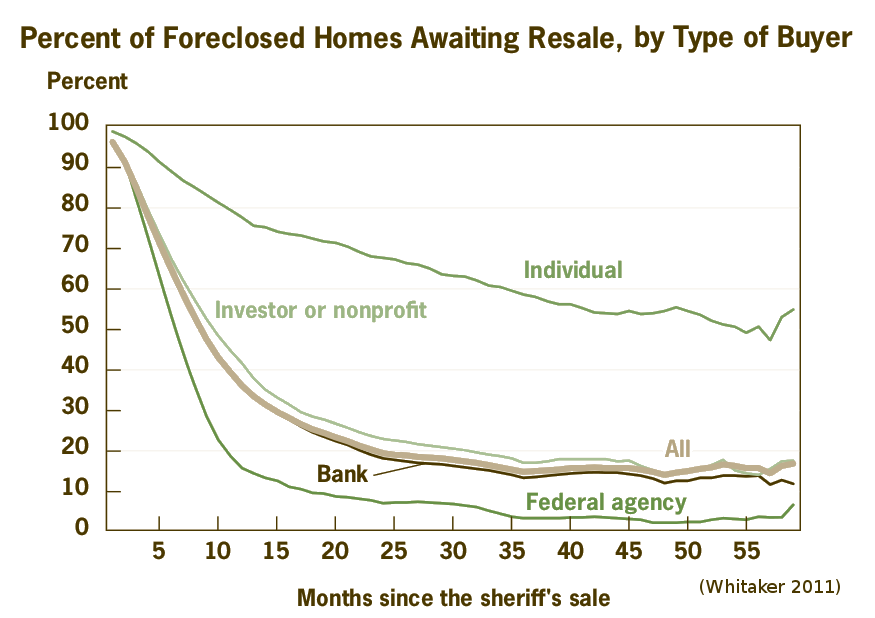
A pair of works emanating from the Federal Reserve Bank of Cleveland did address that question in specific cases. Mikelbank (2008) used a database of vacant and abandoned properties maintained by the City of Columbus to measure the interrelationship between foreclosure, vacancy and abandonment, while noting that the city's database was a unique to Columbus and that maintenance of such data was rare in other cities. Stephan Whitaker and Thomas J. Fitzpatrick IV (Whitaker 2011; Whitaker and Fitzpatrick 2012; Fitzpatrick 2012) more-specifically analyzed the relationship between foreclosure and vacancy in Cleveland using the US Postal Service address database (see figures below). It is unclear how they gained access to that address-level data, although that data is publicly-available from HUD in aggregated form.
Whitaker (2011) found that post-sale foreclosed homes on average had both a longer period and higher rates of post-sale vacancy. It is not clear whether this pattern in Cleveland as a rust-belt city where foreclosures commonly slip into abandonment can be generalized to sun-belt cities where foreclosed housing stock generally gets absorbed in growth.
Market-specificity is a challenge to the creation of a generalized model of the foreclosure-vacancy relationship. Mallach (2009, 15) acknowledged that the mortgage crisis of the late 2000s had broadly deleterious consequences, but also pointed out that, "The magnitude and character of the problem vary greatly across markets, however, as do the market circumstances and state and local policy environments that frame the efforts to respond." Of particular applicability for analysis of Maricopa County is Greenblatt's (2008) observation that the long-term impact of foreclosure-induced vacancy differs between growing sun belt cities vs contracting rust belt cities, with new buyers eventually filling empty houses in the sun belt while vacant houses persist in the rust belt as part of a long-term secular trend of urban decline.
Much of the attention in the literature and the popular press has been focused on vacancy and abandonment as core problems, with the term foreclosure often used as an ill-fitting synonym for those broader issues. Fitzpatrick (2012) addresses this conflation in asserting that "abandonment is really driven by long-term population loss that resulted in an oversupply of housing relative to demand. Plenty of property has been vacant long term or abandoned but has not been through a foreclosure recently." Baxter and Lauria (2000, 692) noted that, "Overall, foreclosure was not directly implicated in changes in either the vacancy rate or the proportion of owner-occupied units in a block group. It had indirect effects, operating through its strong effect on change in black population." Katz et al (2013) noted that a few studies have found an association between foreclosures, vacancy, and crime (Krivo and Peterson 1996; Spelman 1993; Taylor 2001).
In seeking to understand the foreclosure/vacancy relationship within a growing area like Maricopa County, it may be helpful to see foreclosure less as a crisis or anomalous condition and more as a normal component of ownership churn in housing markets. Foreclosure is a feature, not a bug.
Possible Future Directions
A series of reports authored by Steven Whitaker and Thomas J. Fitzpatrick IV at the Cleveland Fed apparently used address-level data from the USPS address database for foreclosure analysis. It is unclear how that access was obtained or what costs were involved. However, such data might be more useful than the aggregated USPS data used in this preliminary research.
Another option might be the undertaking of a mailing strictly for the purpose of processing returned letters. While we had hoped to be able to use returned survey data from the 2006 or 2011 Phoenix Area Social Survey, Marcia Nation at CAP indicated in communications on 27 February 2015 that such data (if it still exists) would not be available due to privacy constraints implemented by an IRB. Nation also indicated that she knew of no other large social surveys that had been undertaken at CAP during the relevant period of analysis for this research.