Survey Vacancy Analysis
Michael Minn - 25 February 2015
This is a partial report on my analysis of your 4/1/2009 returned surveys as a natural experiment in vacancy detection.
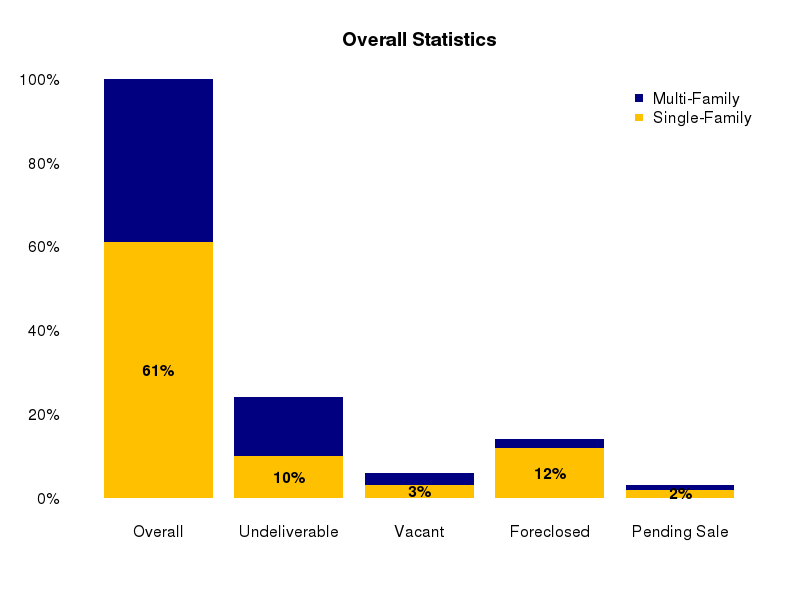
Below is a graphical summary of the statistics on the 3,600 parcels from the survey. "Pending Sale" is the number of parcels that were between the foreclosure auction and the subsequent sale to the next owner.
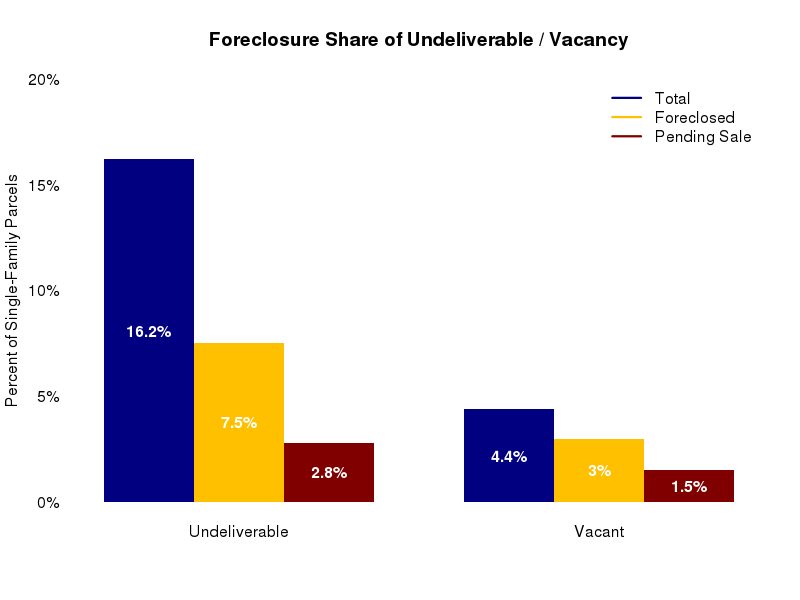
The graph below displays the shares of undeliverable / vacant addresses coinciding with foreclosure / pending-sale:
Focusing more specifically on the dependence between these variables, contingency tables are given below showing that both foreclosure and pending post-foreclosure sale increase the probability of being undeliverable or vacant. The p-values for chi-squared tests are low, indicating that the null hypothesis of independence between these variables should be rejected.
                Foreclosed Unforeclosed
  Deliverable          252         1587
  Undeliverable        165          190


                Awaiting Sale Unforeclosed
  Deliverable              19         1820
  Undeliverable            62          293


           Foreclosed Unforeclosed
  Occupied        351         1747
  Vacant           66           30


           Awaiting Sale Unforeclosed
  Occupied            48         2050
  Vacant              33           63
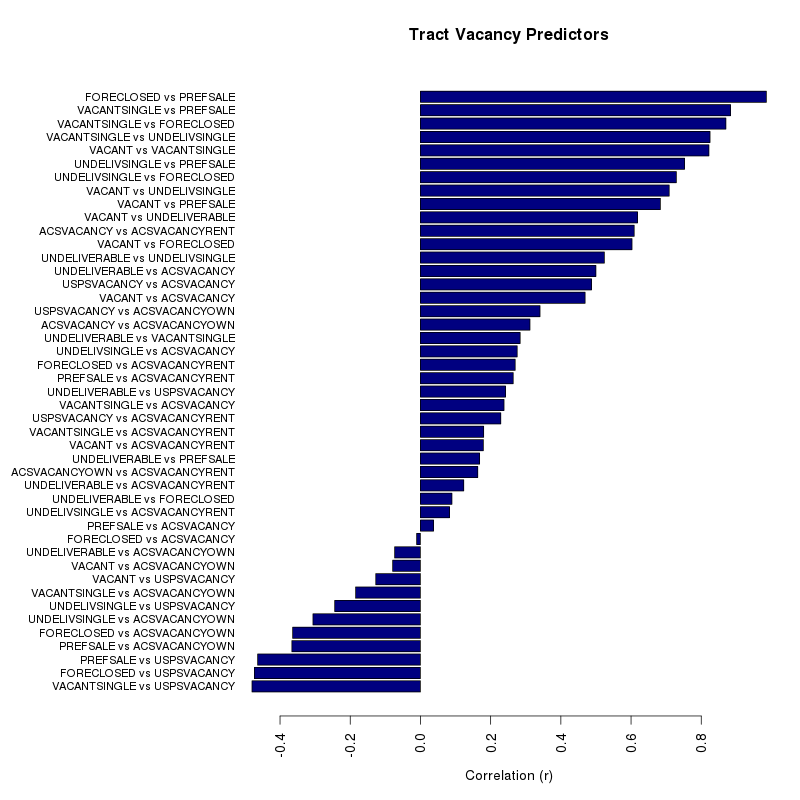
At the tract level, there are fairly high correlations between foreclosure/pending-sale and undeliverability/vacancy.
However, the correlations to ACS and USPS vacancy rates are fairly weak. There were some problems processing the ACS data that need to be rectified, so the verdict is out on ACS vacancy validity.
However, the presence of NEGATIVE correlation between the USPS vacancy data and the observed vacancy/undeliverability data in the survey reinforces the weakness of the USPS data prior to the new methodology implemented in 2010.
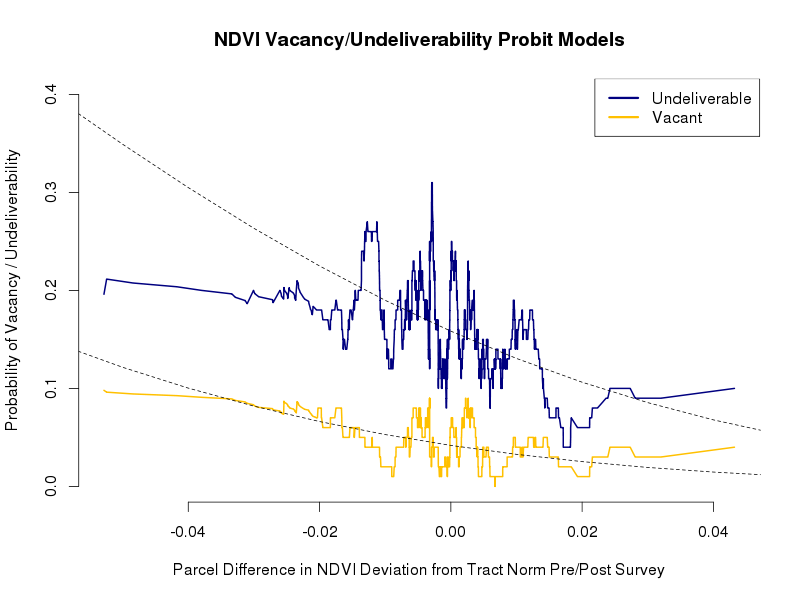
Finally, probit models were run between single-family parcel-level NDVI difference in deviation and undeliverability/vacancy. The graph below displays a running-mean of 0/1 truth values for undeliverability/vacancy along with fitted probit models. As with foreclosure, the models are of questionable strength, although the undeliverability model appears to be stronger than the vacancy model (AIC 751 for undeliverability vs 1865 for vacancy)