Foreclosure Vacancy Analysis
Michael Minn - 11 February 2015
This is a report on the beginning of an project to "analyze data and write a publishable manuscript concerning how foreclosure relates to vacancy" as specified in my appointment form.
The primary challenge in this task is the lack of reliable vacancy data for Maricopa County. We hope to be able to partially address that challenge by synthesizing data from multiple sources:
- Foreclosure data from The Information Market
- Parcel sales data from the Maricopa County Assessor's Office (ST 42025)
- USPS Vacancy Data (2010 - 2012) from the US Department of Housing and Urban Development (HUD)
- Returned survey data from Cutts
- Census and ACS demographic data from the US Census Bureau
Literature Review
At the height of the crisis, Shilling (2009, 108) noted that "there is little, if any, research that explores the relationships between the number and length of time that homes in the foreclosure process become vacant..." Shilling (2009, 109) also asserts that, "Creation of a new model that can track and inventory when foreclosed properties become vacant would be particularly useful...Correlating vacancy with foreclosure is essential for future federal and state assistance to communities, especially for its code enforcement operations."
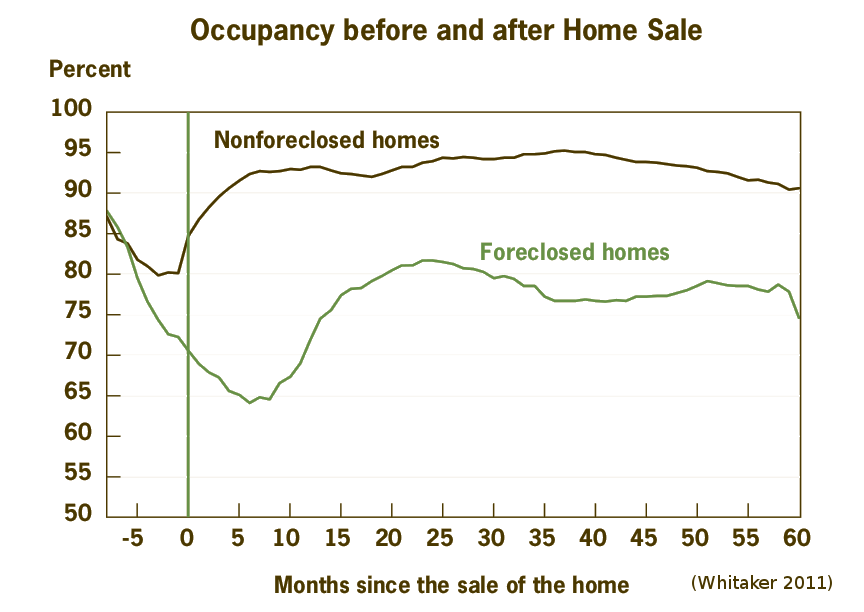
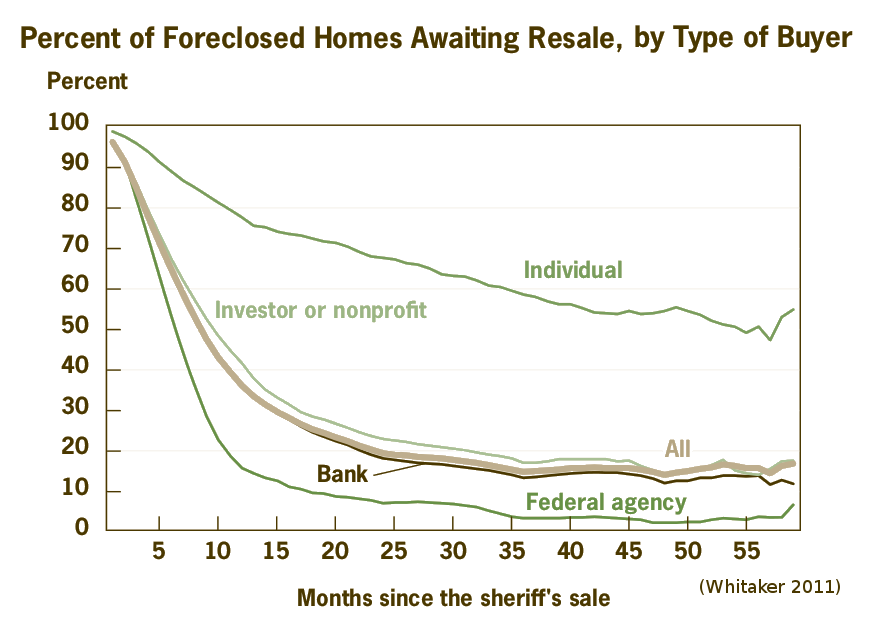
A pair of works emanating from the Federal Reserve Bank of Cleveland did address that question in specific cases. Mikelbank (2008) used a database of vacant and abandoned properties maintained by the City of Columbus to measure the interrelationship between foreclosure, vacancy and abandonment, while noting that the city's database was a unique to Columbus and that maintenance of such data was rare in other cities. Stephan Whitaker and Thomas J. Fitzpatrick IV (Whitaker 2011; Whitaker and Fitzpatrick 2012; Fitzpatrick 2012) more-specifically analyzed the relationship between foreclosure and vacancy in Cleveland using the US Postal Service address database (see figures below). It is unclear how they gained access to that address-level data, although that data is publicly-available from HUD in aggregated form.
Whitaker (2011) found that post-sale foreclosed homes on average had both a longer period and higher rates of post-sale vacancy. It is not clear whether this pattern in Cleveland as a rust-belt city where foreclosures commonly slip into abandonment can be generalized to sun-belt cities where foreclosed housing stock generally gets absorbed in growth.
Market-specificity is a challenge to the creation of a generalized model of the foreclosure-vacancy relationship. Mallach (2009, 15) acknowledged that the mortgage crisis of the late 2000s had broadly deleterious consequences, but also pointed out that, "The magnitude and character of the problem vary greatly across markets, however, as do the market circumstances and state and local policy environments that frame the efforts to respond." Of particular applicability for analysis of Maricopa County is Greenblatt's (2008) observation that the long-term impact of foreclosure-induced vacancy differs between growing sun belt cities vs contracting rust belt cities, with new buyers eventually filling empty houses in the sun belt while vacant houses persist in the rust belt as part of a long-term secular trend of urban decline.
Much of the attention in the literature and the popular press has been focused on vacancy and abandonment as core problems, with the term foreclosure often used as an ill-fitting synonym for those broader issues. Fitzpatrick (2012) addresses this conflation in asserting that "abandonment is really driven by long-term population loss that resulted in an oversupply of housing relative to demand. Plenty of property has been vacant long term or abandoned but has not been through a foreclosure recently." Baxter and Lauria (2000, 692) noted that, "Overall, foreclosure was not directly implicated in changes in either the vacancy rate or the proportion of owner-occupied units in a block group. It had indirect effects, operating through its strong effect on change in black population." Katz et al (2013) noted that a few studies have found an association between foreclosures, vacancy, and crime (Krivo and Peterson 1996; Spelman 1993; Taylor 2001).
In seeking to understand the foreclosure/vacancy relationship within a growing area like Maricopa County, it may be helpful to see foreclosure less as a crisis or anomalous condition and more as a normal component of ownership churn in housing markets. Foreclosure is a feature, not a bug.
Preliminary Analysis
Initial analysis using foreclosure data was based on the hypothesis that the amount of time between the foreclosure auction and the first sale following the auction might be correlated with vacancy rates.
Similarly, higher percentages of homes sold in each tract were hypothesized to be associated with higher levels of vacancy as homes in transition between owners would presumably pass through some period of vacancy.
The animation below plots the percentage of parcels in census tracts that were sold in each quarter versus the census tract vacancy rate reported by the USPS and aggregated by HUD. As with earlier animations using the USPS data, no clear pattern is visible other than the horizontal clustering of tracts around the mean percentages of home sales. This casts doubt on any simple relationship between volume of sales and levels of vacancy.
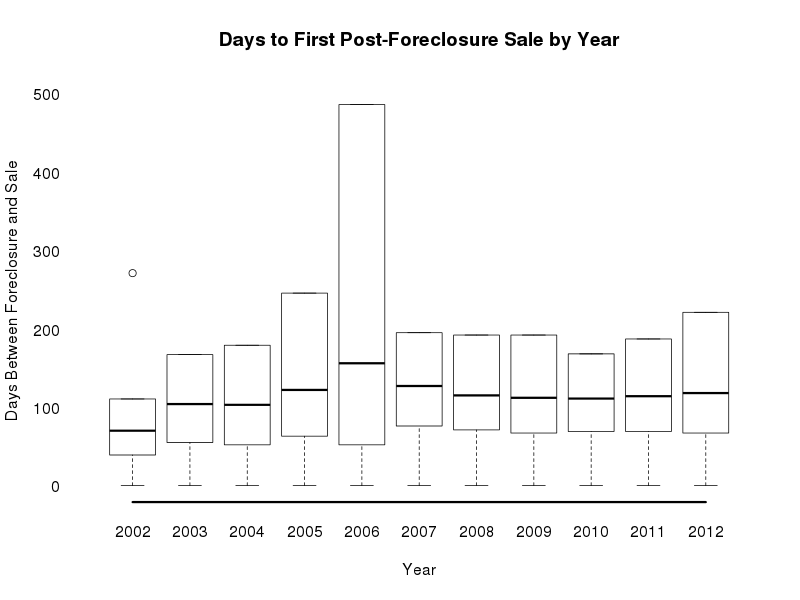
Distribution of the time between foreclosure and the first post-foreclosure sale stayed surprisingly stable during the housing boom and bust. The box graph below shows the quartiles of the distribution over the period from 2002 to 2012. The jump in 2006 reflects the low number of foreclosures at the height of the bubble and, presumably, the low quality of the houses that were actually foreclosed.
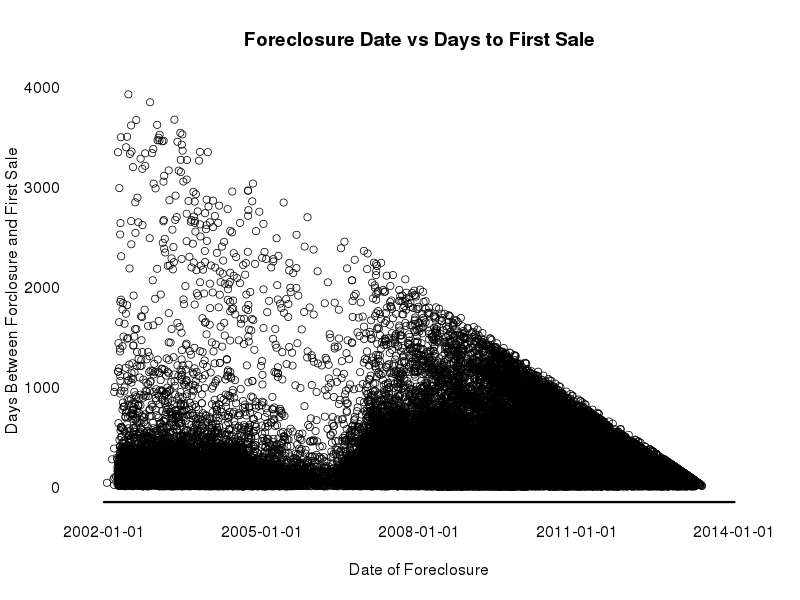
The graph below plots parcels by date of foreclosure versus the number of days to the first post-foreclosure sale. The dip in 2006 again reflects the low number of foreclosures at the height of the bubble.
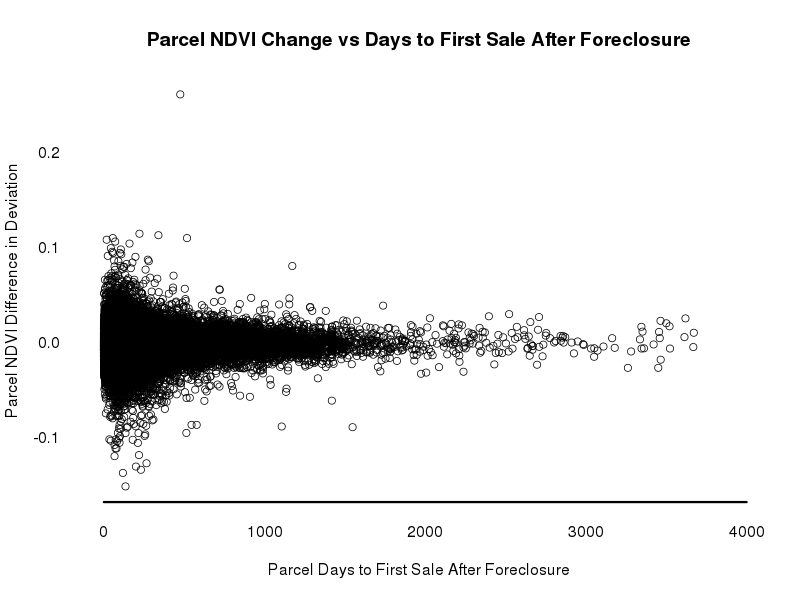
One hope at the outset of this project was to be able to use remotely sensed NDVI data to detect decreases in landscape management (e.g. dead lawns) associated with foreclosure that would imply vacancy. However, the limited amount of observable change (Minn et al forthcoming) will highly restrict the usefulness of this approach. The graph below shows the foreclosed parcel NDVI difference in deviation versus the number of days between foreclosure and the first post-foreclosure sale. No clear relationship is visible other than the curious observation that parcels that take a long time to sell tended to have low variance in pre- vs post-foreclosure NDVI.