Ongoing Landsat Analysis
Michael Minn - 18 September 2014
To identify parcels where foreclosure may be associated with a change in NDVI, this analysis looks for per-parcel changes in deviation from the median NDVI for each parcel's census tract. Median deviation from the tract norm for the year prior to the foreclosure auction and the year following the foreclosure auction are compared. Parcels where there is the largest differential between pre-auction and post-auction deviations are flagged for further investigation.
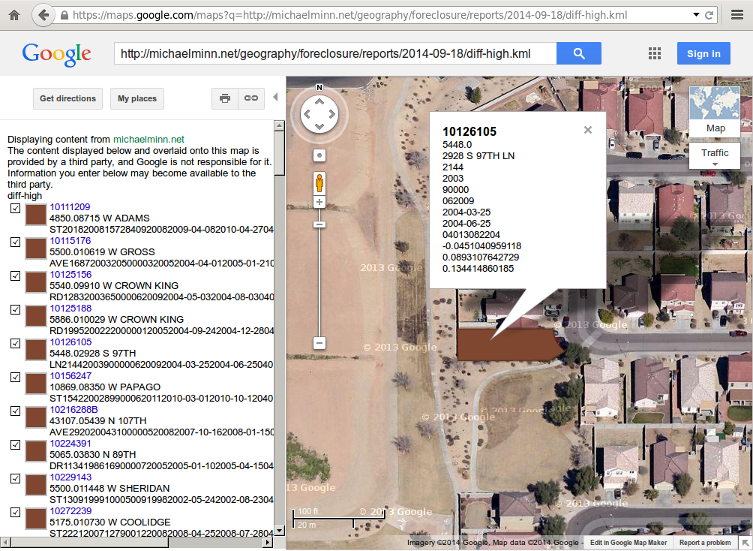
The map below shows the 100 parcels with the HIGHEST positive differential:
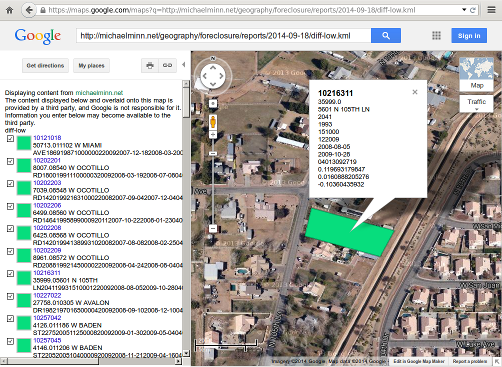
The map below shows the 100 parcels with the LOWEST positive differential:
Example Parcels
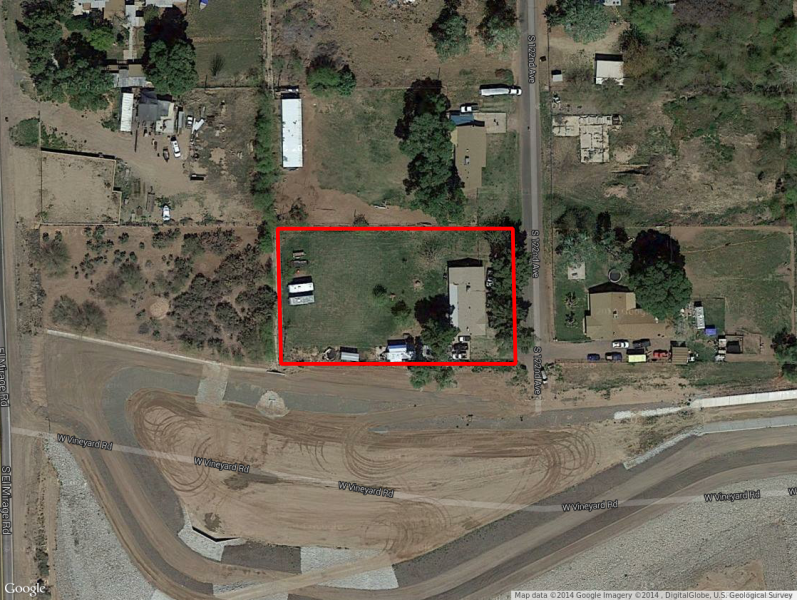
Parcel 50069070 at 6628 S 122ND AVE is a large tract (with grazing area?) in south Avondale.
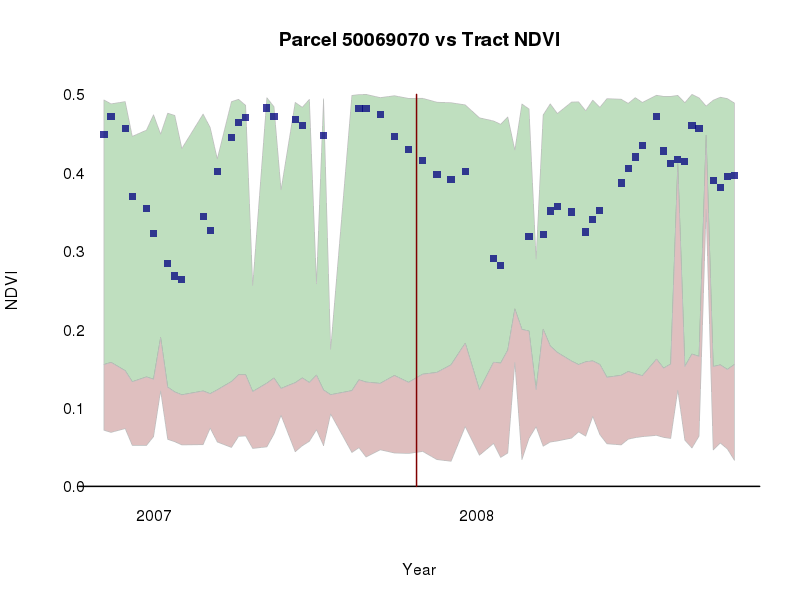
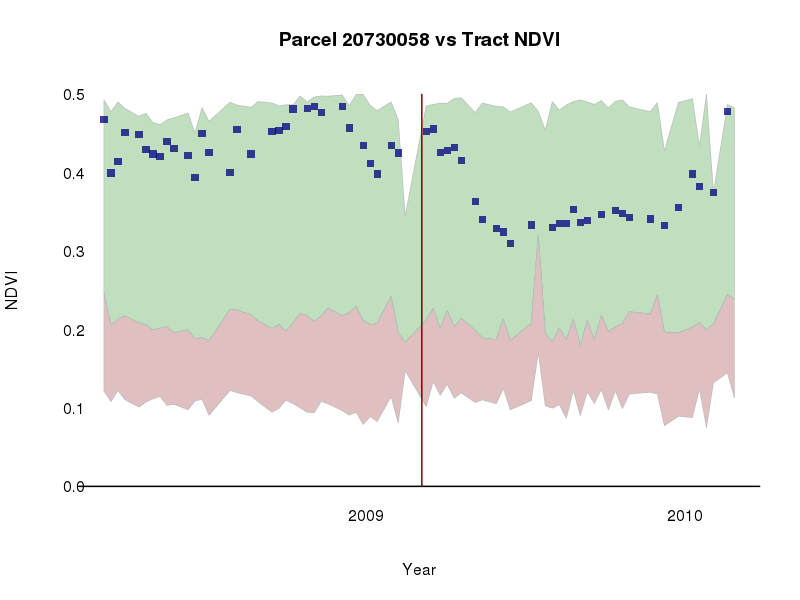
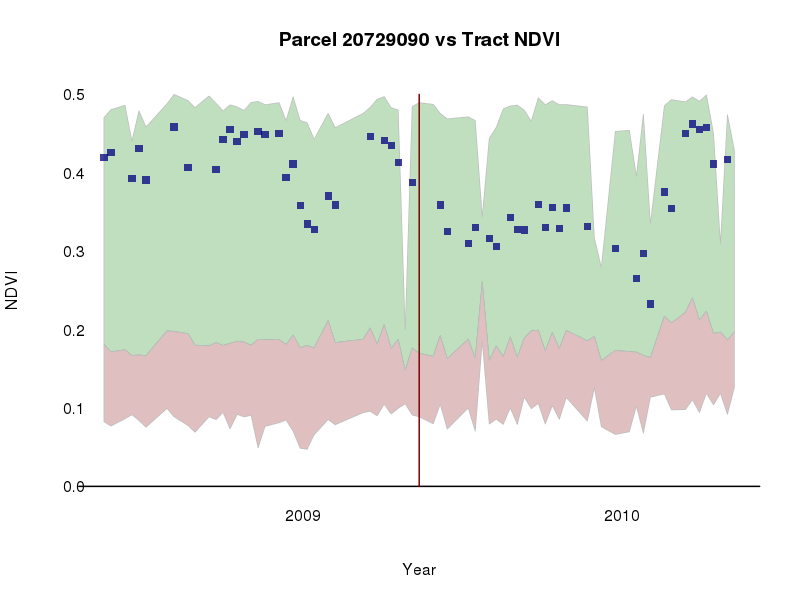
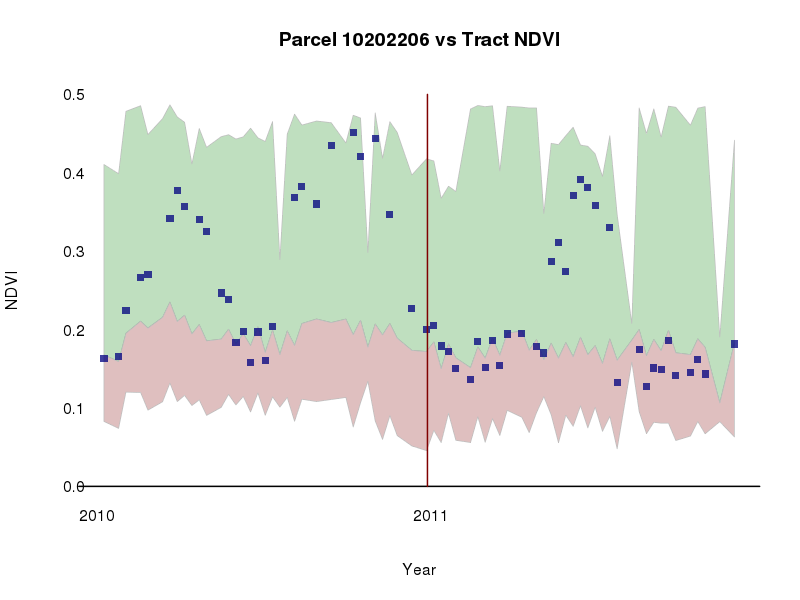
In the chart below, the red area is the lowest 50 percentile of NDVI for parcels in the tract and the green area is the highest 50 percentile. The dividing line is the median. The blue squares are weighted mean Landsat NDVI for the parcel. The red line is the date of the foreclosure auction. There is a noticeable dip in NDVI following the auction, although this may be phenological.
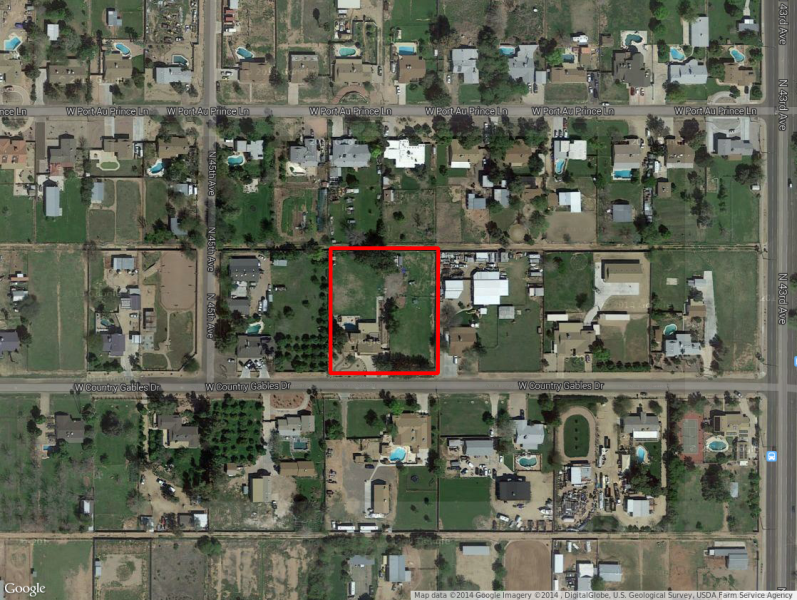
Parcel 20730058 at 4412 W COUNTRY GABLES DR is located in Sunburst Farms. This seems a more likely candidate for foreclosure-induced landscape change.
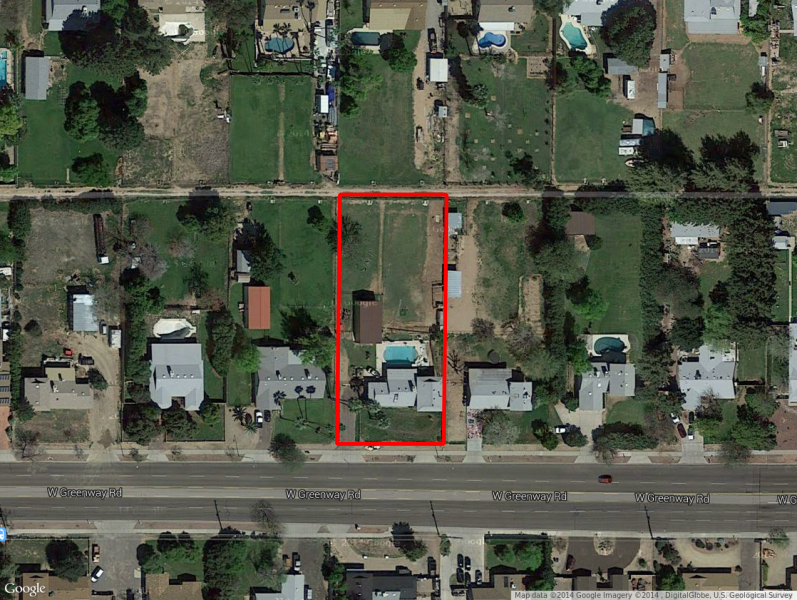
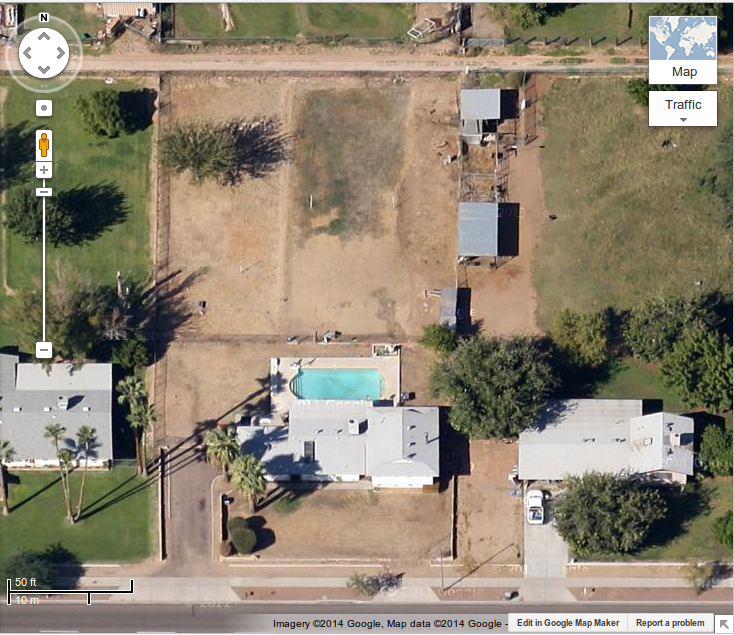
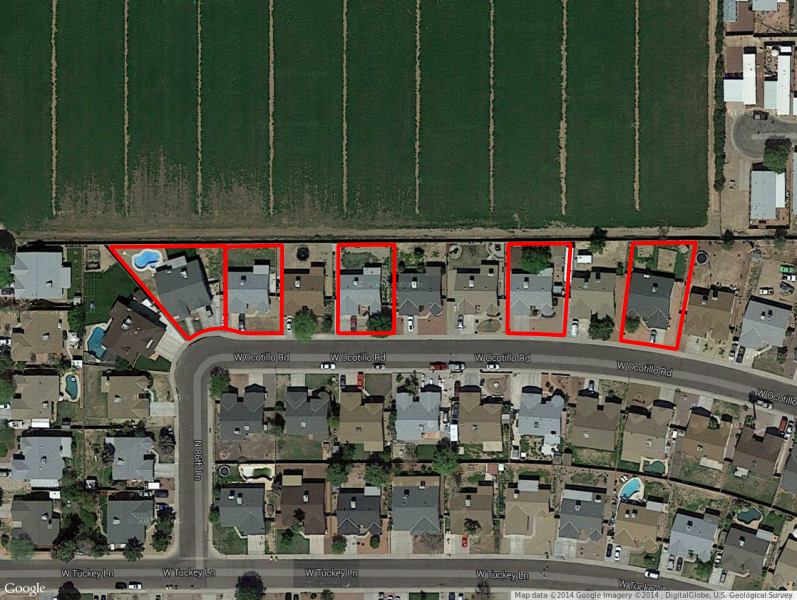
Ditto for parcel 20729090 a few hundred feet to the north at 4402 W GREENWAY. Curiously, the Google Maps image at low zoom shows quite a bit of vegetation, while the orthogonal view at high zoom appears to be from a later date, and shows a barren yard with a removed shed. The transition is clearly visible in the NDVI chart, although whether that resulted from absence of maintenance or an active maintenance choice by a new owner is unclear.
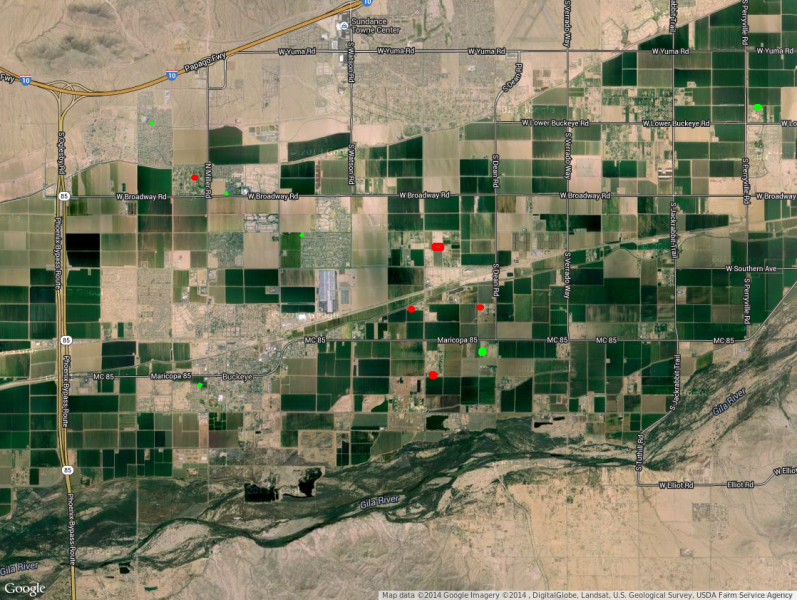
Parcel 10202206 at 8560 W OCOTILLO RD is one of a cluster of foreclosures near an agricultural field in Peoria near University of Phoenix Stadium. The detected change is likely due to registration errors that cause the vegetation change in the field to be inadvertently included in the NDVI calculation for the parcel.
Likewise, there are a number of tracts in Buckeye near agricultural land associated with the Buckeye Canal. NDVI changes may be phenological.
MODIS Followup
Although we will not be using MODIS data for further analysis, as a follow-up, below is an animation of pixels with high levels of foreclosed lawn area plotted against NDVI. Foreclosure is based on the old definition of foreclosure as being between the notice-of-sale (NOS) and a cancelled sale or successful auction. The 100 pixels displayed are selected from across the analysis period 2002-2012 as those that had the highest level of foreclosed lawn area at any point during the analysis period, approximating the 99.9th percentile. Values are interpolated with a cubic spline to make transitions more visible.
In most cases, the pixels make horizontal transitions when going into foreclosure, indicating no relationship between NDVI and foreclosure, which is not consistent with the quantile regression. However, there are some pixels that appear to drop NDVI during the foreclosure period, so this does not disprove the existence of areas where there is a foreclosure/NDVI relationship.