Preliminary Landsat Analysis
Michael Minn - 3 September 2014
The following is some preliminary visualization and analysis of Landsat data for Maricopa County.
Landsat Visible Bands Animation
Below is a time-series animation of Landsat visible bands (RGB) over the period 2002-2012. Cloud-obsured areas are filled from prior frames. An animation with clouds left in place is available here...
Landsat NDVI Animation
Below is a time-series animation of Landsat NDVI over the period 2002-2012. Cloud-obsured areas are filled from prior frames. An animation with clouds left in place is available here...
There is a noticeable surge in NDVI around the Winter Solstice which we also noticed with the MODIS data, and which may be due to satellite passing over the county when there is limited, steeply-angled light at the end of the day (5:30 pm), as can be observed above.
Parcel NDVI vs Days Before/After Foreclosure
Landsat NDVI over the analysis period has been joined with the parcel data and is now available for analysis.
As an exploration of the findings from the MODIS quantile analysis, below is an animation of parcel counts vs Landsat NDVI as parcels approach and recede from the foreclosure auction date.
- The Y-axis is Landsat NDVI on the date specified on the subtitle at the bottom of the chart
- The X-axis is the number of days before/after the foreclosure auction
- Bubble size is a logarithm of the number of parcels in the group
- Parcels that do not go into foreclosure are in the <200-day group
- Parcels that pass through multiple foreclosure auctions are considered separately for each proceeding (appear multiple times)
- Frames where bubbles shrink or disappear are frames where parcels are heavily obscured by clouds
The three gray lines are the 90%, 50% (median) and 10% quantiles. As can be observed, the lines tend to stay fairly stable as parcels pass from pre-foreclosure to post-foreclosure.
There is a small, but fairly consistent drop in the 90% quantile between pre- and non-foreclosure parcels (< 200 days), which hints that parcels with higher-than-average levels of vegetation are less likely to be in foreclosure. However, the absence of any clear contours over the days preceding and following foreclosure give no indication of widespread lawn management change directly associated temporally with foreclosure. Indeed, as shown in the heat tables, foreclosure incidence at the tract level has an inverse correlation with mean home price and mean home age - foreclosure is less likely in wealthy and/or established neighborhoods.
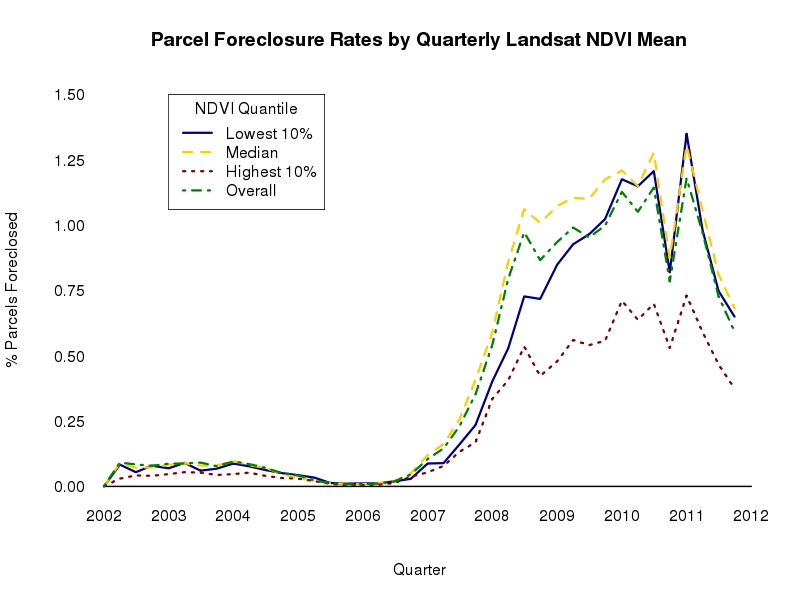
Parcel Foreclosure Rates by NDVI Quantile
The chart below gives the foreclosure rate by NDVI quantiles. NDVI is averaged over quarters. Foreclosure rate is the percentage of parcels that pass through a foreclosure auction during each quarter. Across the analysis period, parcels in the top 10% of NDVI (highest levels of vegetation) generally have lower foreclosure rates, which is consistent with the observations made regarding the NDVI/foreclosure animation above.