Visualizing Foreclosure: Phoenix - Animations
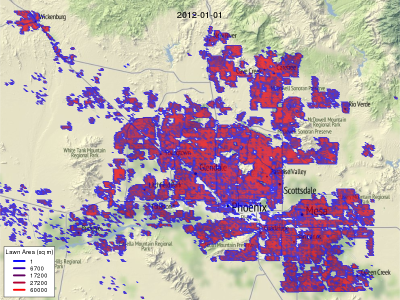
Animated Map of Lawn Area Growth
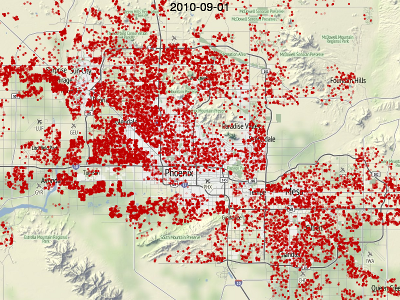
Animated Map of Foreclosed Parcels
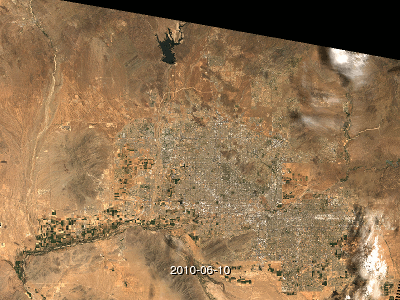
Landsat RGB (clouded areas filled from previous frames)
Landsat RGB (with clouds)
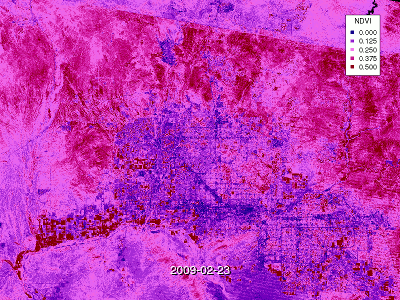
Landsat NDVI (clouded areas filled from previous frames)
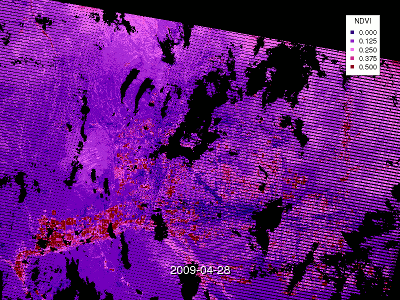
Landsat NDVI (with cloud gaps)
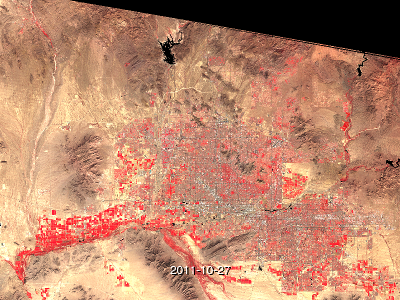
Landsat False Color (clouded areas filled from previous frames)
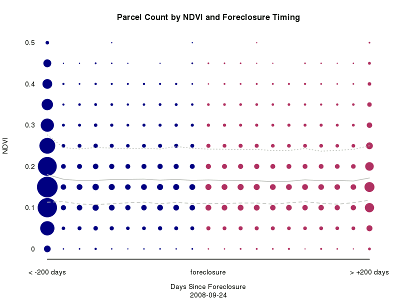
Animation of Landsat NDVI Parcel Counts vs Days to/from Foreclosure
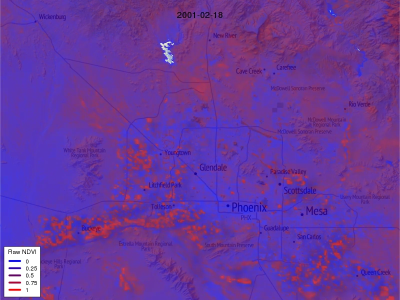
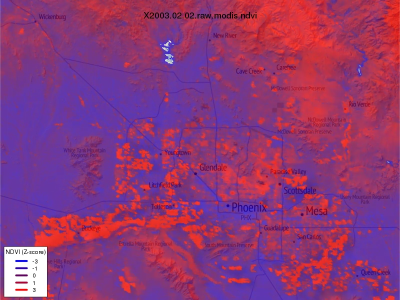
Animated Raw MODIS Normalized Differential Vegetation Index (NDVI)
MODIS NDVI displayed as a normalized Z-score to mitigate some of the noise
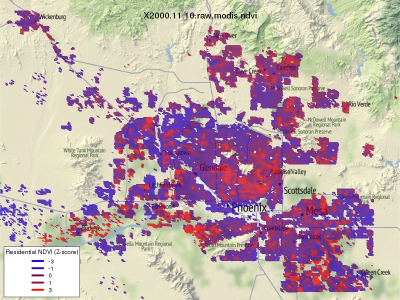
MODIS NDVI displayed as a normalized Z-score and masked to display only area with residential parcels
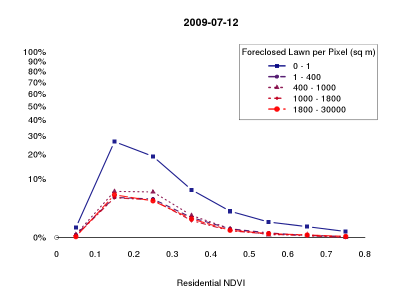
Animated Histogram of NDVI by Ranges of Distressed Lawn per Raster Cell
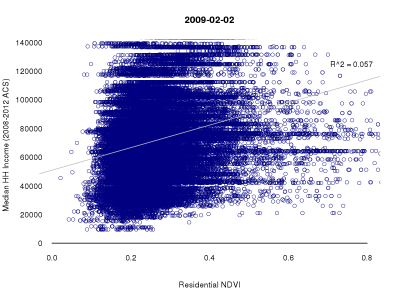
Animated X-Y Scatter of NDVI vs Tract Median HH Income
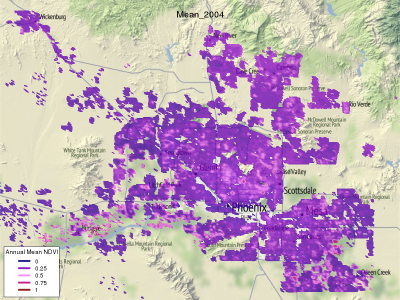
Animated Annual Mean NDVI for Each Pixel for 2002-2011 (10 layers)
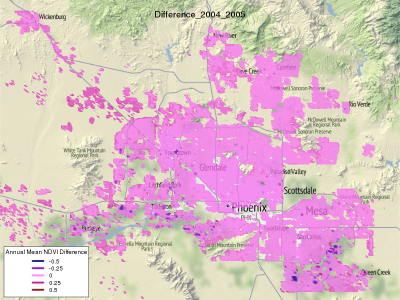
Animated Annual Mean NDVI Differential: 2002-2003 to 2010-2011 (9 layers)
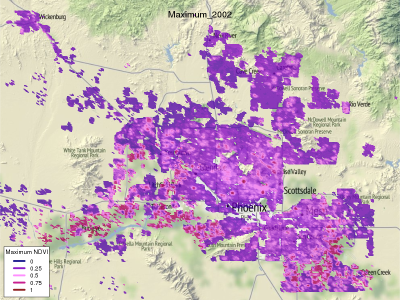
Animated Annual Maximum NDVI 2002-2011 (10 layers)
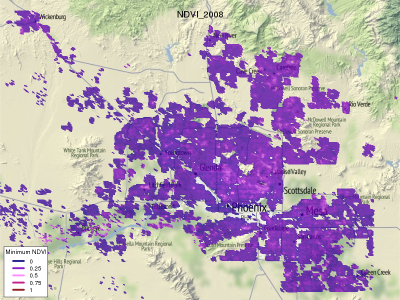
Animated Annual Minimum NDVI 2002-2011 (10 layers)
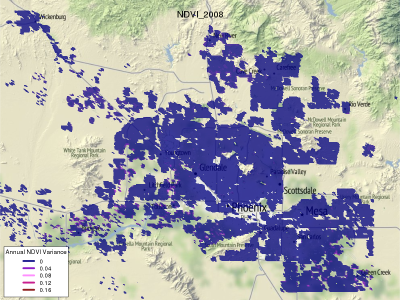
Animated Annual NDVI Variance 2002-2011 (9 layers)