Mapping the Outcomes of Urban Sustainability Policies to Determine Spatial Equity: Chicago
4 June 2014
Principal Investigator: Prof. Julie Cidell (jcidell [at] illinois.edu)
Research Assistant: Michael Minn (minn2 [at] illinois)
Funded by the University of Illinois Campus Research Board, award RB14025
The following is a follow-up to the preliminary report of 20 April for Mapping the Outcomes of Urban Sustainability Policies to Determine Spatial Equity. This report focuses specifically on point-pattern analysis for the City of Chicago for four separate sustainability initiatives: bike sharing, rain-barrel rebate programs, green buildings and brownfield redevelopment.
Data
All points and regions in this analysis are bounded by the extent of the City of Chicago as defined in the 2013 TIGER/Line(R) places shapefile for the State of Illinois, downloaded on 31 May 2014. Boundaries for census tract and ZIP Code Tabulation Areas (ZCTA) were taken from the 2012 TIGER/Line shapefiles.
The 2008-2012 American Community Survey (ACS) 5-year Estimates were used for neighborhood demographic, housing and economic characteristics. This is the most recent data available down to the ZCTA and tract level. This data was downloaded from the US Census Bureau American FactFinder website (http://factfinder2.census.gov) and was selected from three separate ACS data sets. Each data series is referenced by the field name used in the census-zip shapefile.
- DP03 - SELECTED ECONOMIC CHARACTERISTICS
- PCUNEMPLOY (HC01_VC13): EMPLOYMENT STATUS - Percent Unemployed
- PCDRIVE (HC01_VC29): COMMUTING TO WORK - Car, truck, or van -- drove alone
- HHINCOME (HC01_VC85): INCOME AND BENEFITS (IN 2012 INFLATION-ADJUSTED DOLLARS) - Median household income (dollars)
- DP04 - SELECTED HOUSING CHARACTERISTICS
- HHRENTER (HC03_VC64): HOUSING TENURE - Renter-occupied
- PCNOVEHICL (HC03_VC82): VEHICLES AVAILABLE - 1 vehicle available
- DP05 - ACS DEMOGRAPHIC AND HOUSING ESTIMATES
- POPTOTAL (HC01_VC03): Total population
- MEDIANAGE (HC01_VC21): Median age (years)
- PCWHITE (HC03_VC72): Percent; RACE - White (Race alone or in combination with one or more other races)
- PCBLACK (HC03_VC73): Percent; RACE - Black or African American (Race alone or in combination with one or more other races)
- PCHISPANIC (HC03_VC81): Percent; HISPANIC OR LATINO AND RACE - Total population
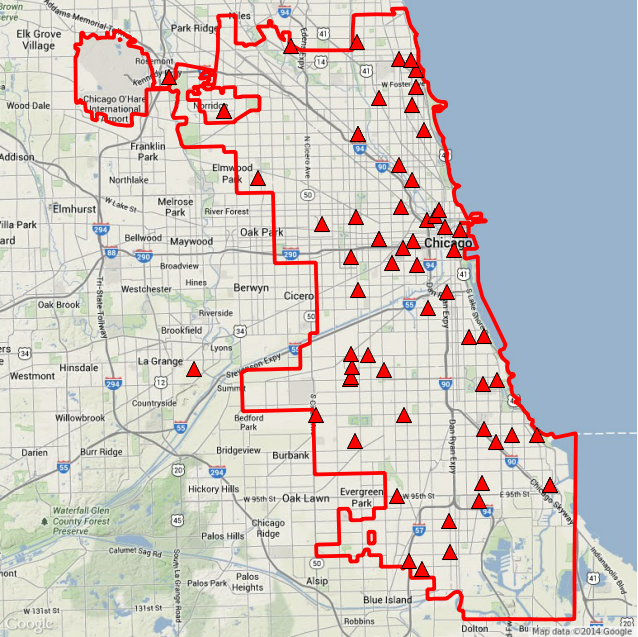
Bike sharing station locations with the number of slots per station were downloaded from the Divvy bikes website (www.divvybikes.com/stations), which is a program of the Chicago Department of Transportation (CDOT). Data downloaded on 24 January 2014 contains 300 sites.
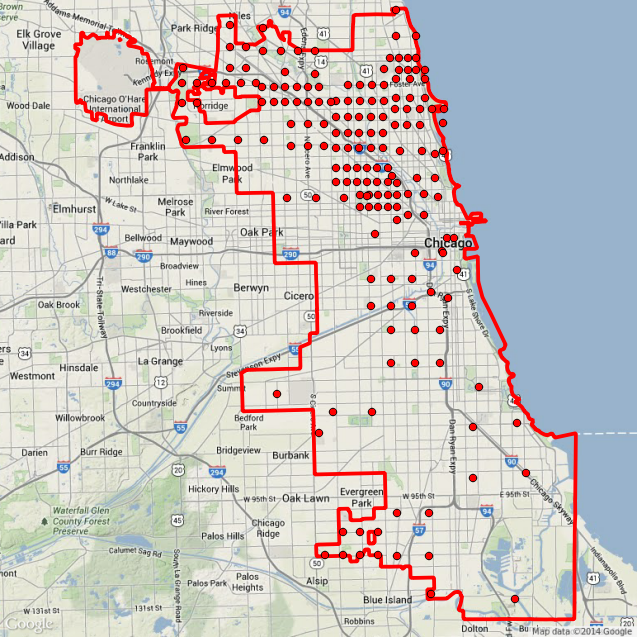
Household rain barrel rebate program information for the Chicago Sustainable Backyards program (www.sustainablebackyards.org) was obtained on 10 February 2014 from officials at the the Center for Neighborhood Technology (www.cnt.org), which administers the program in partnership with the city government. To preserve privacy, barrel locations were aggregated by ZIP code, with 167 barrels in 21 of the city's 56 ZCTA. For point pattern analysis, points within ZCTA were simulated using the R dotsInPolys() function, with the caveat that the inexactness of these locations introduces error that reduces the accuracy of analysis involving rain barrels.
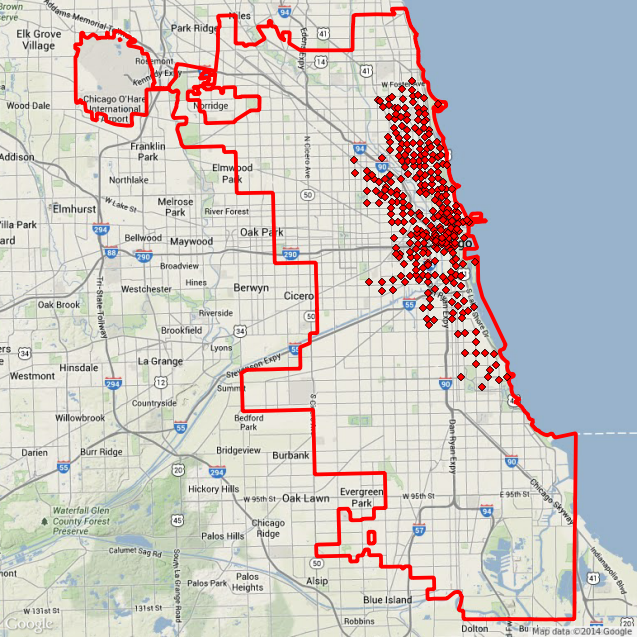
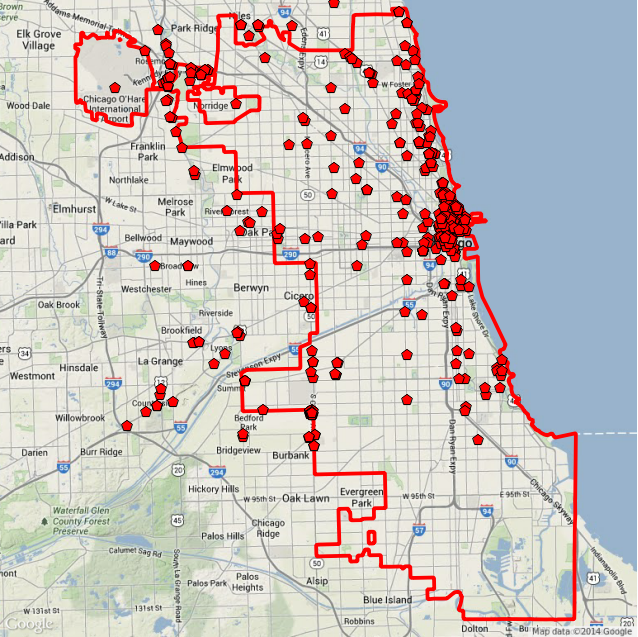
Green building data was downloaded from the US Green Building Council listing of LEED-certified projects (www.usgbc.org/projects) on various dates in late March and early April 2014. There are 778 buildings within the boundaries of the City of Chicago in this data. Crudely geocoded location information contained in the downloaded data introduces some level of error in the analysis.
59 buildings with brownfield LEED credits receive separate treatment as Green buildings on Brownfields.
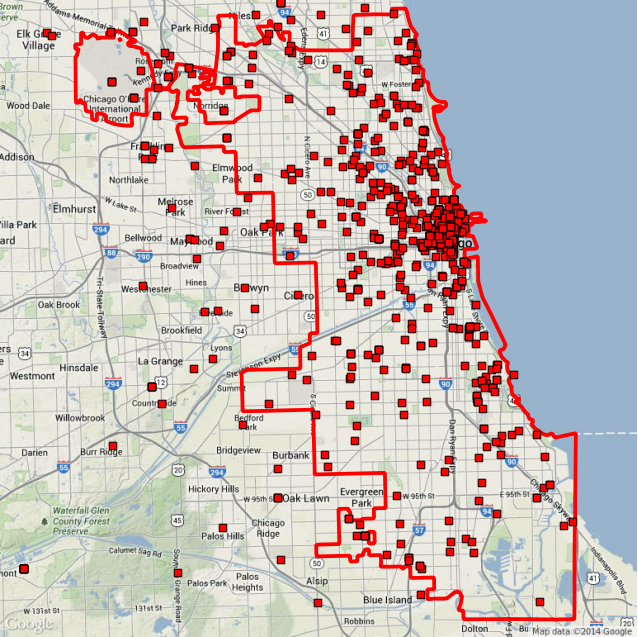
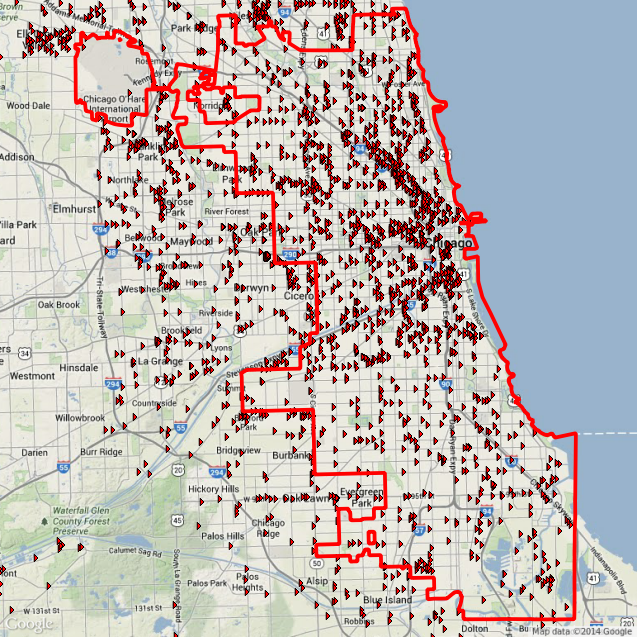
Brownfield data for this analysis was obtained from the the Illinois EPA Site Remediation Program (http://epadata.epa.state.il.us/land/srp/). This includes 1,649 sites within the City of Chicago. As mentioned in the earlier report, there are serious epistemological and ontological issues with available brownfield data. Accordingly, analysis based on this data should be used for guidance rather than support.
Hotel data was downloaded from the online Urban Guide Yelp.com on 1 June 2014. 487 hotels / motels were listed for the Chicago metro area, with 378 located within the boundaries of the City of Chicago. Geocoding was performed with the Google API. The accuracy of this data and the geocoding is uncertain.
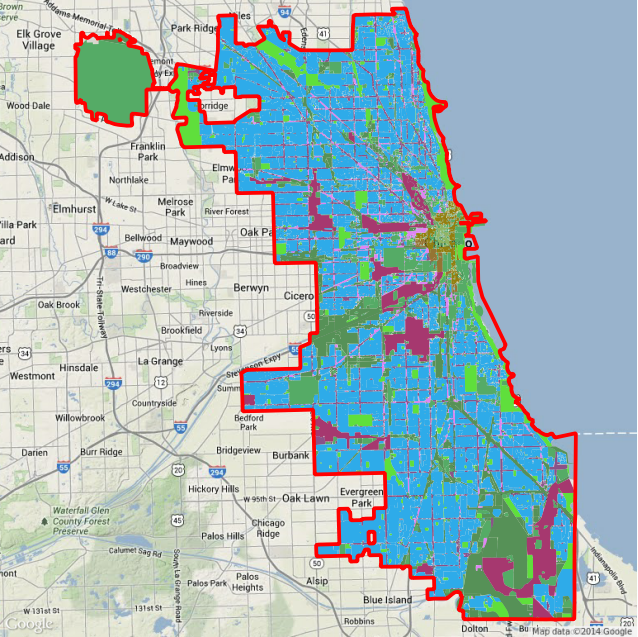
Zoning data for the city was downloaded from the City of Chicago data portal (data.cityofchicago.org) on 1 June 2014.
This data was processed with R Spatial and visualized with QGis. The data is available as shapefiles in data-2014-06-04.zip.
Density Within ZCTA
As a general exploratory methodology, counts of points within ZCTA were correlated with Census and hotel count data associated with each of those ZCTA. The table below lists the R2 correlation coefficients. Higher numbers indicate a higher level of correlation.
| PCUNEMPLOY | PCDRIVE | HHINCOME | HHRENTER | PCNOVEHICL | MEDIANAGE | PCWHITE | PCBLACK | PCHISPANIC | HOTELS | |
|---|---|---|---|---|---|---|---|---|---|---|
| GREENBLDG | 0.157 | 0.104 | 0.165 | 0.012 | 0.020 | 0.001 | 0.078 | 0.076 | 0.000 | 0.166 |
| GREENBROWN | 0.014 | 0.050 | 0.019 | 0.002 | 0.001 | 0.019 | 0.032 | 0.036 | 0.000 | 0.003 |
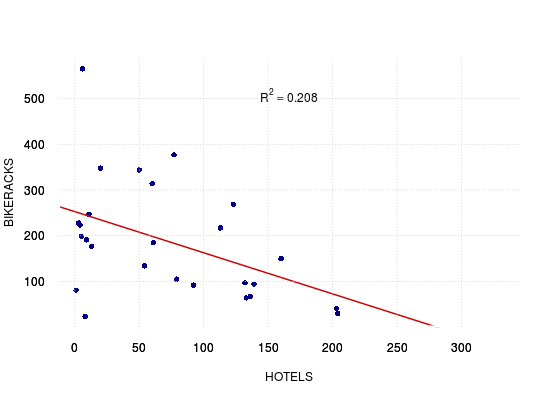
| BIKERACKS | 0.112 | 0.000 | 0.035 | 0.073 | 0.033 | 0.013 | 0.129 | 0.098 | 0.015 | 0.208 |
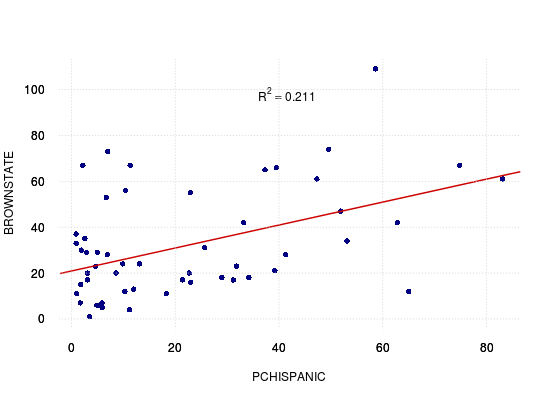
| BROWNSTATE | 0.017 | 0.011 | 0.058 | 0.005 | 0.021 | 0.108 | 0.010 | 0.000 | 0.211 | 0.004 |
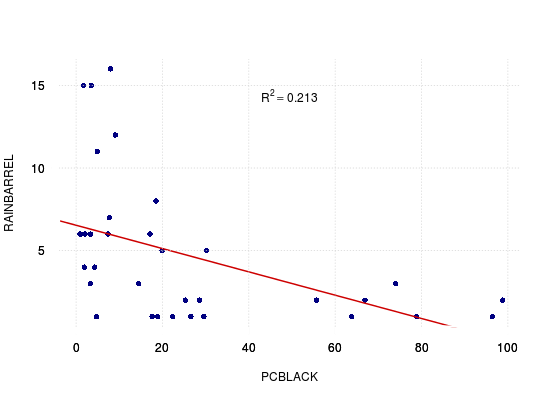
| RAINBARREL | 0.068 | 0.027 | 0.004 | 0.002 | 0.073 | 0.000 | 0.182 | 0.213 | 0.141 | 0.032 |
As indicated in the preliminary report, there are only a limited number of weak correlations present.
Number of brownfields has a slight positive correlation with percent Hispanic population.
Number of rain barrels has a slight negative correlation with percent African-American population, although this may be due to the larger percentage of the population that is white (48% white vs 33% African-American).
There is also a weak negative correlation between number of bike sharing racks and hotels. This may be due to the large number of bike racks in residential areas.
Logit Probability Analysis
To mitigate the modifiable-area unit problem associated with density calculations like the ones above, logit regression was used to relate the effect of demographic characteristics of census tracts on the probability that at least one point is present in those tracts.
Below is a table listing the associated McFadden pseudo R2 (calculated as 1 - (residual_deviance / null_deviance)) and the AIC (Akaikie Information Criteria) that indicate goodness of fit. Higher R2 and lower AIC indicate a stronger relationship between the demographic characteristic and the geographic presence of a sustainability policy within that tract. The magnitude of pseudo R2 has a tendency to understate goodness of fit in comparison to real R2 used with linear regression.
| PCUNEMPLOY | PCDRIVE | HHINCOME | HHRENTER | PCNOVEHICL | MEDIANAGE | PCWHITE | PCBLACK | PCHISPANIC | HOTELS | |
|---|---|---|---|---|---|---|---|---|---|---|
| GREENBLDG | 0.019 / 936 | 0.018 / 937 | 0.016 / 939 | 0.001 / 953 | 0.005 / 950 | 0.000 / 954 | 0.014 / 941 | 0.010 / 945 | 0.007 / 953 | 0.044 / 164 |
| GREENBROWN | 0.000 / 386 | 0.009 / 383 | 0.002 / 386 | 0.000 / 386 | 0.004 / 385 | 0.000 / 386 | 0.000 / 386 | 0.000 / 386 | 0.008 / 384 | 0.000 / 87 |
| BIKERACKS | 0.126 / 677 | 0.171 / 642 | 0.145 / 662 | 0.018 / 760 | 0.016 / 762 | 0.009 / 767 | 0.101 / 696 | 0.071 / 719 | 0.000 / 775 | 0.074 / 159 |
| BROWNSTATE | 0.002 / 1039 | 0.003 / 1039 | 0.001 / 1040 | 0.000 / 1041 | 0.001 / 1040 | 0.001 / 1041 | 0.000 / 1041 | 0.002 / 1040 | 0.020 / 1026 | 0.023 / 148 |
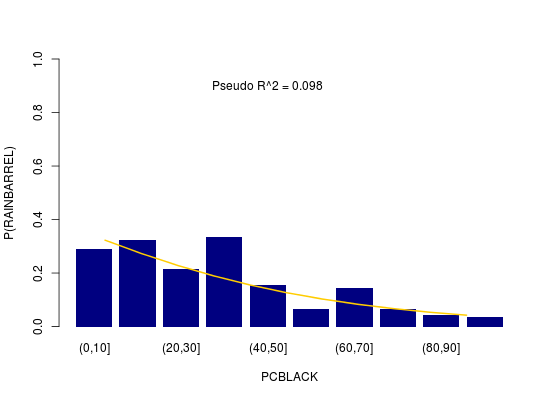
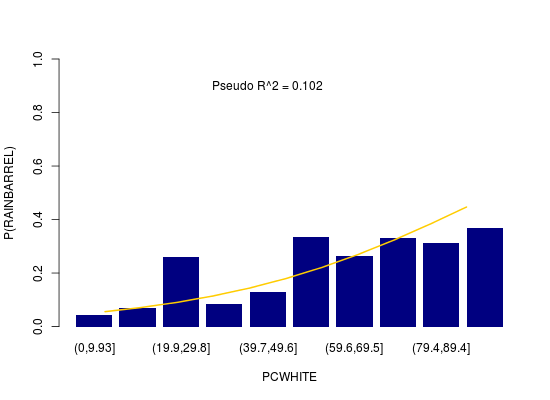
| RAINBARREL | 0.080 / 723 | 0.006 / 780 | 0.044 / 751 | 0.013 / 775 | 0.031 / 761 | 0.011 / 776 | 0.102 / 705 | 0.098 / 708 | 0.024 / 768 | 0.013 / 135 |
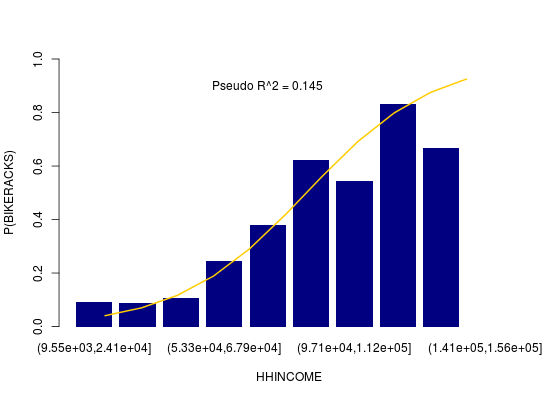
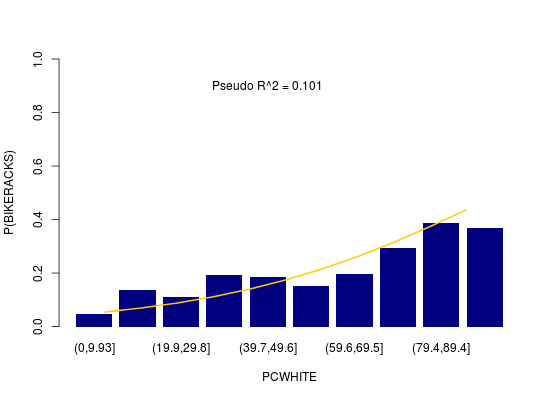
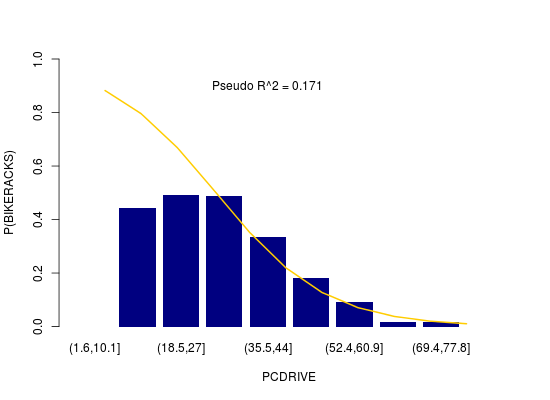
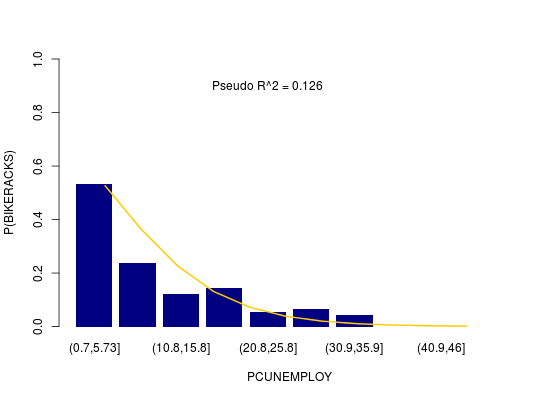
As with ZCTA density analysis above, there are a limited number of weak relationships indicated with logit regression. In each of the graphs below, the yellow line is the modeled probability and the blue bars represents observed probability based on the percentage of tracts in the given ranges of the independent variable that contain at least one point for the given sustainability policy.
There is a weak negative relationship between percent African-American population and the probability of presence of a rain barrel in a tract. Accordingly there is a weak positive relationship between percent white population and presence of a rain barrel.
Bike sharing racks exhibit slightly more dramatic relationships. There is a positive relationship between the probability of the presence of a bike rack in a census tract and both median household income and percent white population.
There is a negative relationship between the probability of the presence of a bike rack in a census tract and both the percentage of persons who drive to work alone and the unemployment rate.
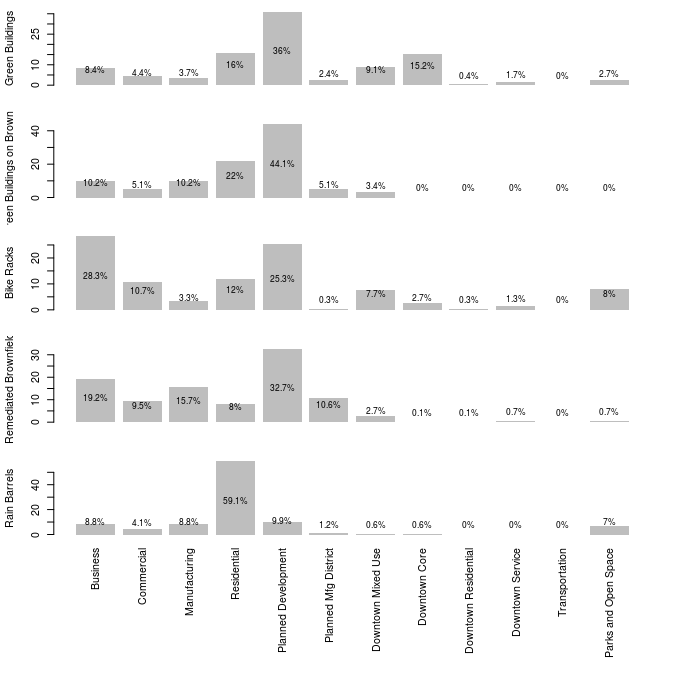
Zoning
Below are percentage distributions for the point locations within the twelve different city zoning types.
Of special note is the large percentage of sites (except residential rain barrels) located in areas zoned as planned development, which hints at the importance of policy in promoting participation in these initiatives.
Nearest Neighbor Analysis
Finally, nearest-neighbor analysis was performed to investigate whether there might be any significant proximity relationships between different sustainability policies. Listed below is a matrix of mean nearest-neighbor relationships in feet. Smaller numbers indicate that points in the compared sets have a tendency to be closer to each other.
Of special note may be the proximity of most locations to remediated brownfields. However, this may be more a reflection of the ubiquity of brownfields than the tendency of these efforts to cluster geographically.
| ↓ From / To → | Green Buildings | Green Buildings on Brownfields | Bike Racks | Remediated Brownfields | Rain Barrels | Hotels |
|---|---|---|---|---|---|---|
| Green Buildings | 0 | 1354 | 2228 | 404 | 1146 | 1127 |
| Green Buildings on Brownfields | 0 | 0 | 4498 | 274 | 1557 | 2519 |
| Bike Racks | 460 | 1304 | 0 | 372 | 935 | 683 |
| Remediated Brownfields | 847 | 2062 | 4226 | 0 | 1617 | 2393 |
| Rain Barrels | 963 | 2729 | 5023 | 590 | 0 | 2109 |
| Hotels | 421 | 1669 | 1945 | 414 | 1288 | 0 |
Note that the relationships are not symmetrical. For example, since green buildings on brownfields are a subset of overall green buildings, the mean nearest neighbor distance from each green building on a brownfield to its nearest green building neighbor is zero, since the nearest green building neighbor for each brownfield building is itself. But the mean distance from each green building and the nearest green building on a brownfield is 1,354 feet since most green buildings are not on brownfields, so there is distance from many green buildings to their nearest brownfield neighbor.
Conclusions
While this analysis is more detailed than the broad all-city analysis of the preliminary report, there are still only a limited number of weak correlations evident in this city-wide analysis. While this analysis does hint at possible relationships, these relationships are likely quite complex and would require more specific and detailed qualitative and quantitative analytical work to uncover meaningful patterns.