Landsat Data in R
This tutorial covers the basic acquisition, import, and visualization of Landsat data in R.
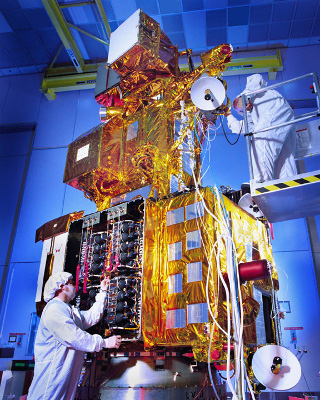
Landsat is the name of a joint NASA / USGS program that provides repetitive, calibrated, satellite-based observations of the earth at a spatial resolution that enables analysis of man's interaction with the environment. (NASA 2021).
The Landsat 1 satellite was launched on 23 July 1972 and subsequent satellites have provided continuous satellite imagery of the Earth. This is arguably one of the most important scientific enterprises of our time, and if you work with remote sensing, you will probably use Landsat data on multiple occasions.
Landsat 7 (launched 1999) and Landsat 8 (launched 2013) are operational as of this writing. Landsat 9 is scheduled for launch in 2021 and will replace Landsat 7 with a satellite that is functionally similar to Landsat 8 (NASA 2020).
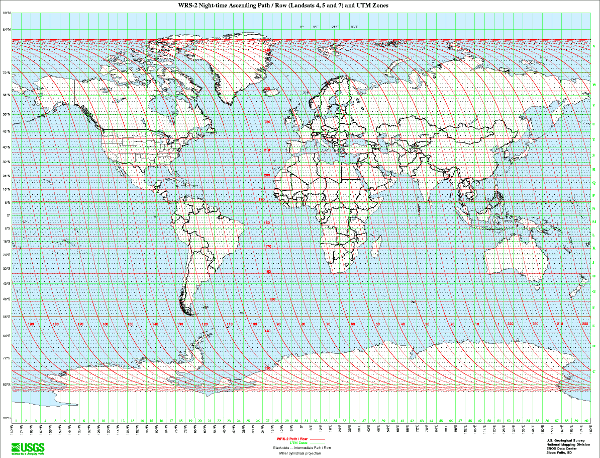
Landsat satellites complete just over 14 orbits a day, covering the entire earth every 16 days. Landsat satellites travel in a near-polar, sun-synchronous orbit so they spend as much time as possible looking at sunlit area.
Acquire the Data
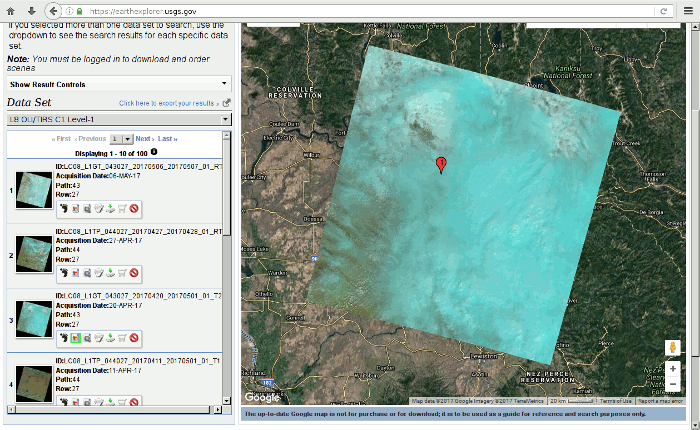
The USGS makes recent and historic Landsat data freely available via the EarthExplorer website.
- Scenes: Landsat data is publicly available as scenes (images) that cover an area around 100 miles square. Scenes are designated by a path number (scanning path west to east) and row number (scene location on the path south to north).
- Collections: Landsat data has been released in two different collections, numbered one and two. Collection 2 incorporates the most recent processing enhancements to provide the best accuracy (USGS 2021).
- Levels: Landsat data is also released at two different quality levels. Level-1 scenes are higher quality than Level-2 scenes.
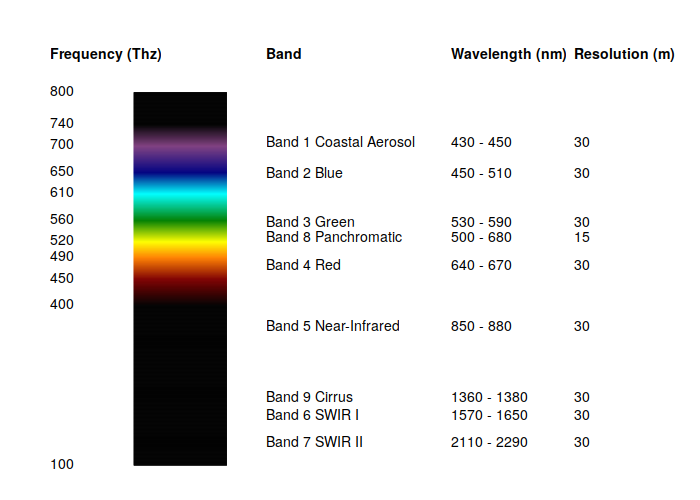
- Sensors: While historic scenes dating back to Landsat 1 (1972) are available from the multispectral scanner system carried on Landsats 1 to 4, this sensor had lower spatial resolution (68 m X 83 m) and lower spectral resolution (four bands) than the thematic mapper sensors (30 m resolution and seven bands) that were launched on Landsat 4 in 1982 and Landsat 5 in 1984. Therefore, unless you specifically need scenes from the 1970s, the oldest data you will probably want to use will be Landsat 4 or 5.
- Clouds: Because Landsat only passes over any given location on the surface of the earth every 16 days, if that happens to be a cloudy day at your point of interest on the day of interest, you will be out of luck. Therefore finding a clear scene will often be a challenge, especially during winter in cloudy northern climates.
Registration
In order to download data, you need to register (for free). Click the Login button and select Create New Account.
Scene Downloads
For the most recent scenes, you should use Landsat 8 data. In this example we download both a summer and a winter scene.
- Log in
- To get data for a specific location, search with a Feature Name and State and select a location that you want to explore.
- Select the appropriate collection and sensor.
- If you want the most recent scenes, use: Landsat -> Landsat Collection 2 Level-1 -> Landsat 8 OLTI/TIRS C1 Level-1.
- If you want historical scenes, use: Landsat -> Landsat Collection 2 Level-1 -> Landsat 4 - 5 TM C1 Level-1.
- View scene footprints that are in the time frame of interest, that cover your area of interest, and are not covered in clouds. Be aware that for vegetation analysis, summer scenes are better.
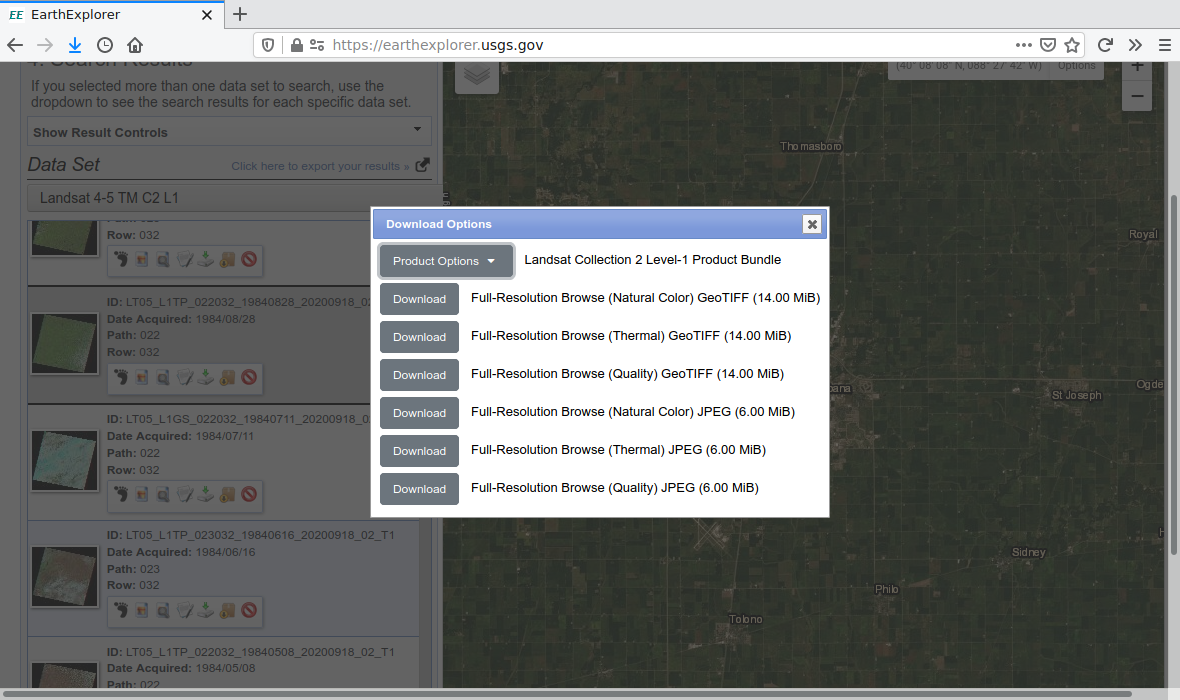
- Click Download and you will be given multiple options.
- If you just need visible light imagery, the Full Resulotion Browse (Natural Color) GeoTIFF is the simplest (single file) option.
- If you are doing some kind of multi-band analysis (such as NDVI analysis), dowload the full (and large) Landsat Collection 2 Level-1 Product Bundle.
- Create a new working directory and
uncompress the data files into that directory.
- The Natural Color image files are made available directly as GeoTIFF (.tif) files that require no additional processing.
- The Product Bundle data is a .tar archive contianing GeoTIFF files for individual bands that can be extracted using a program like 7-zip.
Band Files
The product bundle from EarthExplorer is in a Unix .tar archive file that contains a collection of band files.
If you are on a Windows system, you may be able to extract the contents of the .tar archive simply by double-clicking the .tar file in Windows Explorer.
On a Unix-based system like RStudio, you can extract the archive contents in the Terminal using the shell command tar with the -xvf options (extract, verbose, file name), followed by the .tar file name. For example, with an LC08 (Landsat 8) file and LT05 (Landsat 5) file, these two tar commands would extract the contents.
tar -xvf LC08*.tar
tar -xvf LT05*.tar
Individual Landsat bands for a scene are placed in separate GeoTIFF files that are distinguished by the ends of their names. For example, for Landsat 8 level 1 data (LC08_L1TP), path 23 and row 32 (023032) on 6 June 2021 (20210622), the following files are data files for the 11 different bands
- LC08_L1TP_023032_20210622_20210629_02_T1_B1.TIF (coastal aerosol - ultraviolet)
- LC08_L1TP_023032_20210622_20210629_02_T1_B2.TIF (blue)
- LC08_L1TP_023032_20210622_20210629_02_T1_B3.TIF (green)
- LC08_L1TP_023032_20210622_20210629_02_T1_B4.TIF (red)
- LC08_L1TP_023032_20210622_20210629_02_T1_B5.TIF (near infrared)
- LC08_L1TP_023032_20210622_20210629_02_T1_B6.TIF (shortwave infrared 1)
- LC08_L1TP_023032_20210622_20210629_02_T1_B7.TIF (shortwave infrared 2)
- LC08_L1TP_023032_20210622_20210629_02_T1_B8.TIF (panchromatic)
- LC08_L1TP_023032_20210622_20210629_02_T1_B9.TIF (cirrus)
- LC08_L1TP_023032_20210622_20210629_02_T1_B10.TIF (thermal infrared 1)
- LC08_L1TP_023032_20210622_20210629_02_T1_B11.TIF (thermal infrared 2)
Additional GeoTIFF files provide more-detailed information about the data and data processing.
- LC08_L1TP_023032_20210622_20210629_02_T1_QA_PIXEL.TIF: Pixel quality adjustment band
- LC08_L1TP_023032_20210622_20210629_02_T1_QA_RADSAT.TIF: Radiometric saturation and terrain occlusion QA band
- LC08_L1TP_023032_20210622_20210629_02_T1_SAA.TIF: Solar azimuth angle
- LC08_L1TP_023032_20210622_20210629_02_T1_SZA.TIF: Solar zenith angle
- LC08_L1TP_023032_20210622_20210629_02_T1_VAA.TIF: Sensor azimuth angle
- LC08_L1TP_023032_20210622_20210629_02_T1_VZA.TIF: Sensor zenith angle
Memory and Bandwidth Considerations
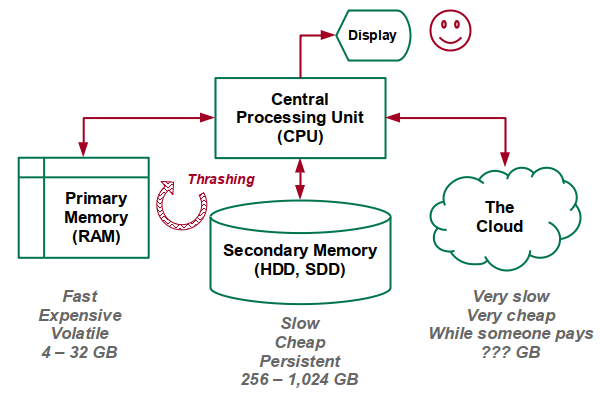
Note that rasters are often large files that take a long time to load and consume considerable disk space, memory, and connection bandwith.
If your machine has inadequate memory to keep all the data in memory, your machine may begin thrashing data back and forth between RAM and your hard disk (virtual memory). This will result in very slow performance from all apps running on your machine, and you will likely need to kill R to regain control of your computer.
If you have inadequate memory, you will need to find a machine with more RAM (such as a lab machine on UIUC AnyWare), you will need to add memory to your machine, or you may need to acquire a more powerful machine.
An unrelated source of performance degradation can occur if you are working on a lab machine that stores data on a computer network. Having to constantly transfer your data across a network can consume a considerable amount of unnecessary time. This can be especially serious if you are connected to the internet through a poor Wi-Fi connection rather than a fast wired connection.
If you are storing your data on a network drive, you should consider downloading and performing your work on your local hard drive, and then saving your work at completion to the network drive.
Landsat 8 RGB Visualization
The raster Package
Raster data in R is commonly handled with the raster package, which you can install with install.packages() before you use it the first time.
install.packages("raster")
The raster package provides three different raster structures that you choose from depending on how many bands you need for a scene, and how many files they come from:
- raster() = one file, one band
- brick() = one file, multiple bands. Commonly used with RGB images
- stack() = multiple files, multiple bands (Landsat GeoTIFFs)
Stacks
To create a RasterStack for a visible light RGB scene:
- Create three raster() for the red, green, and blue band files.
- Combine those into a single raster stack().
- Use the plotRGB() to display the stack
- The scale=65535 parameter is needed because Landsat 8 data is published with 16-bit values that range from 0 to 65535.
Because the Landsat sensors have a wide dynamic range to be able to handle a variety of different terrains, the values for a scene may be in the low range of potential values, which will result in a very dark visualization.
library(raster)

blue = raster("LC08_L1TP_023032_20210622_20210629_02_T1_B2.TIF")
green = raster("LC08_L1TP_023032_20210622_20210629_02_T1_B3.TIF")
red = raster("LC08_L1TP_023032_20210622_20210629_02_T1_B4.TIF")

rgb = stack(red, green, blue)

plotRGB(rgb, scale=65535)
Cropping
Landsat scenes cover a land area of over 200 square kilometers, which, along with the dark rendering, can make it difficult to distinguish what locations are being displayed.
If your focus is on a fairly small area within the scene, cropping the scene will both make it easier to see where you are, and will reduce the memory needed to process the scene further.
- Create an empty raster() with the top left (ymx and xmn) and bottom right (ymn and xmx) lat/long coordinates.
- projectExtent() that raster into the projected coordinate system of the source rasterStack.
- crop() the source rasterStack to the projected extent.
- plotRGB() the cropped rasterStack.
boundary = raster(ymx=40.17, xmn=-88.38, ymn=40.03, xmx=-88.10)

boundary = projectExtent(boundary, rgb@crs)

champaign = crop(rgb, boundary)

plotRGB(champaign)
Stretch
In some cases, the stretch option on plotRGB() can improve the rendering of the scene. lin stretches the values evenly from the minimum to the minimum, and hist distributes them more evenly across the range.
In both cases with this particular scene, the results make features more visible, but the visual contrast is harsh and, arguably, unappealing.
plotRGB(champaign, stretch="lin")
plotRGB(champaign, stretch="hist")
Custom Stretch
Using hist() to show a histogram of the distributions of values across the different bands shows the heavy skewing of the distributions so that most values are in the (dark) low end of the distribution in all bands. This explains why the default plotRGB() is so dark.
This function reads all values from the raster files and may take a few seconds to complete.
hist(rgb)
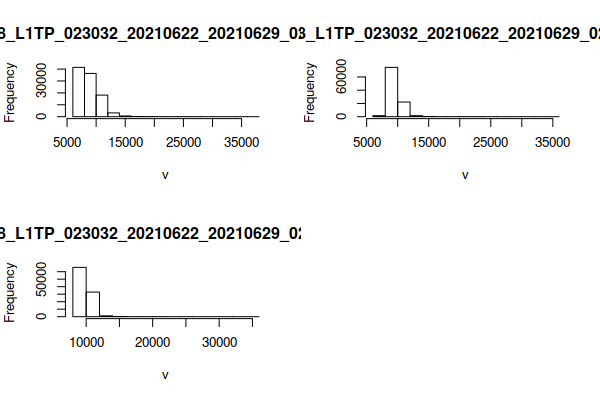
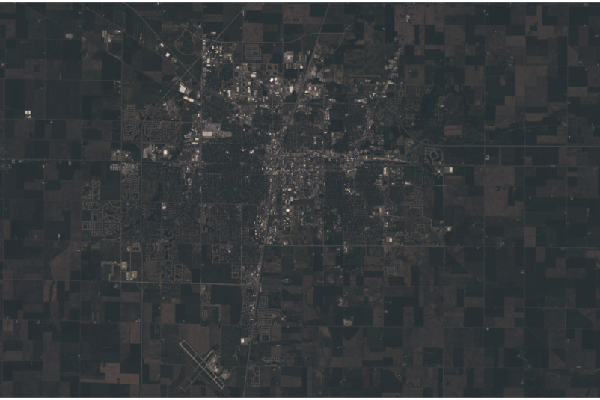
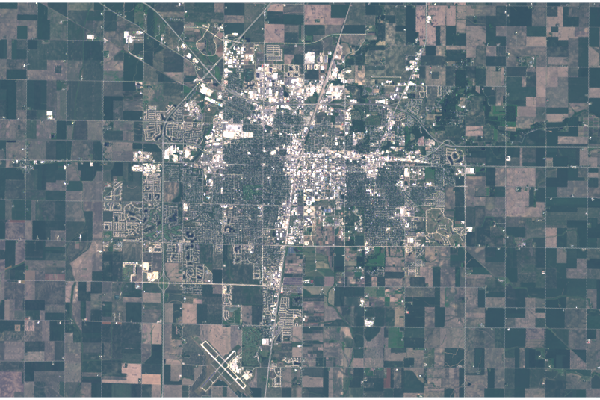
Given that knowledge of the distribution, you can use the zlim and scale parameters to more clearly define range of values that will be displayed. The values that look best will depend on the content of your specific scene.
- The champaign - 6000 darkens the overall scene by subtracting 6000 from all pixels so that most of the lowest values are clipped off.
- The scale parameter defines the highest value in the data. This should probably be the same as the maximum ext value unless you specifically want to darken the scene by making the highest displayed value less than the highest value that the display can render.
- The zlim parameter defines the range of values that can be processed.
plotRGB(champaign - 5000, scale=12000, zlim=c(0, 12000))
Levels
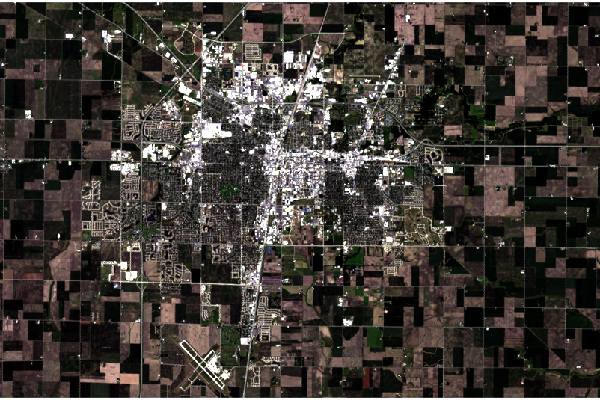
The custom stretch performs the same operation on all values, which can imbalance the colors and gives the scene a slight tinting and or haze. The channel rasters can be individually adjusted for leveling and gamma shift.
- The crop() should be performed before the math to reduce the amount of memory needed for the modified raster data.
- The subtraction and division serves the same purpose as the xlim minimum and maximum scaling above.
- The reset of negative values to zero is needed to avoid invalid values when exponents are used.
- The exponents perform a gamma stretch by shifting the lower values up to lighten the dark areas with saturated greens in this largely agricultural area. Values below one increase the curve shift and values above one decrease the shift.
- This scaling and shifting moves the values to a range of zero to one, which should be reflected in the plotRGB() parameters.
blue = raster("LC08_L1TP_023032_20210622_20210629_02_T1_B2.TIF")
green = raster("LC08_L1TP_023032_20210622_20210629_02_T1_B3.TIF")
red = raster("LC08_L1TP_023032_20210622_20210629_02_T1_B4.TIF")

blue = crop(blue, boundary)
green = crop(green, boundary)
red = crop(red, boundary)

blue = ((blue - 7000) / 10000)
green = ((green - 7000) / 10000)
red = ((red - 7000) / 10000)

blue[blue < 0] = 0
green[green < 0] = 0
red[red < 0] = 0

blue = blue^0.95
green = green^0.5
red = red^0.4

rgb = stack(red, green, blue)
plotRGB(rgb, scale=1, zlim=c(0, 1))
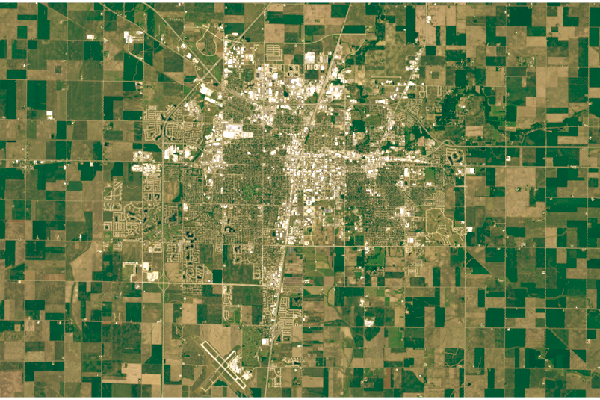
Landsat 5 RGB Visualization
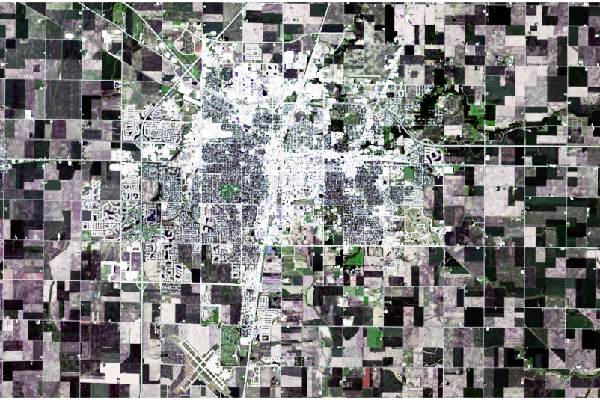
Because Landsat data has been collected for almost half a century, it can be used to detect broad land use changes. The process of visualizing Landsat 5 RGB data is largely the same as with Landsat 8, although the differences in band numbering and bit depth necessitate different parameters.
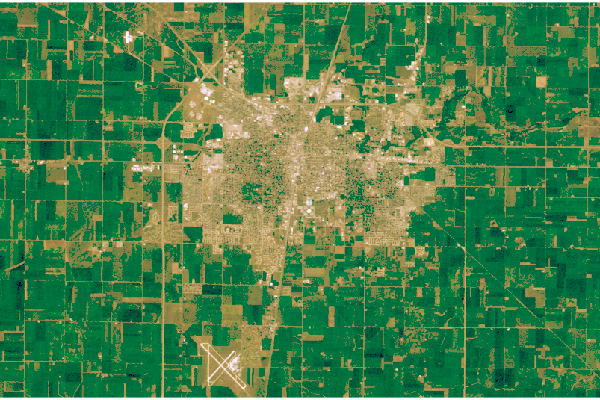
This Landsat 5 scene is from 28 August 1984. Note that the Landsat 5 Thematic Mapper band numbering is different from the newer Landsat 8 band numbering.
library(raster)

blue = raster("LT05_L1TP_022032_19840828_20200918_02_T1_B1.TIF")
green = raster("LT05_L1TP_022032_19840828_20200918_02_T1_B2.TIF")
red = raster("LT05_L1TP_022032_19840828_20200918_02_T1_B3.TIF")

rgb = stack(red, green, blue)

boundary = raster(ymx=40.17, xmn=-88.38, ymn=40.03, xmx=-88.10)

boundary = projectExtent(boundary, rgb@crs)

champaign = crop(rgb, boundary)

plotRGB(champaign, stretch="lin")
Levels
As with the Landsat 8 scene, linear stretching creates harsh contrast that can be scaled and stretched to give a more pleasing visualization.
blue = raster("LT05_L1TP_022032_19840828_20200918_02_T1_B1.TIF")
green = raster("LT05_L1TP_022032_19840828_20200918_02_T1_B2.TIF")
red = raster("LT05_L1TP_022032_19840828_20200918_02_T1_B3.TIF")

boundary = raster(ymx=40.17, xmn=-88.38, ymn=40.03, xmx=-88.10)
boundary = projectExtent(boundary, red@crs)

blue = crop(blue, boundary)
green = crop(green, boundary)
red = crop(red, boundary)

blue = ((blue - 30) / 120)
green = ((green - 30) / 70)
red = ((red - 30) / 70)

blue[blue < 0] = 0
green[green < 0] = 0
red[red < 0] = 0

blue = blue^1.7
green = green^0.3
red = red^0.2

rgb = stack(red, green, blue)
plotRGB(rgb, scale=1, zlim=c(0, 1))
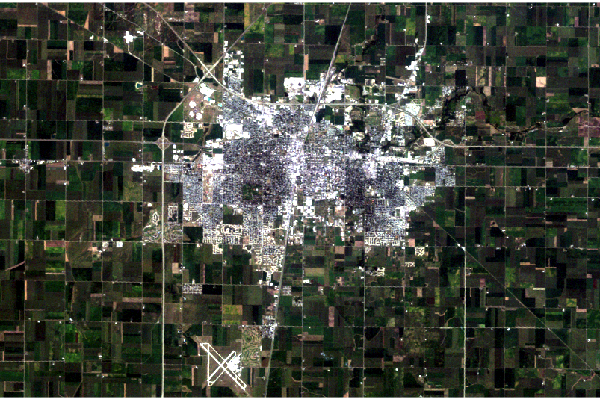
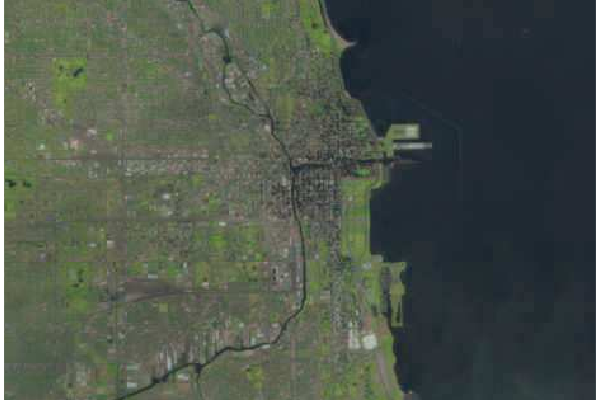
Natural Color Images
USGS also publishes preprocessed three-band composite RGB files that can be downloaded directly without having to combined band files or perform additional correction. These are the Full-Resolution Browse (Natural Color) GeoTIFF option on the download dialog in EarthExplorer. These are actually false-color images constructed with the infrared and red bands, but in they often render well in RGB and require much less work to use than stacks constructed from band files.
Because the natural color scenes are in single composite files, use the brick() function to load the image into memory and the plotRGB() function to display the brick as a single image. Optionally, you can also crop the image as described above.
rgb = brick("LC08_L1TP_023031_20200822_20200905_02_T1_refl.tif")

boundary = raster(ymx=41.922, xmn=-87.72, ymn=41.838, xmx=-87.552)

boundary = projectExtent(boundary, rgb@crs)

rgb = crop(rgb, boundary)

plotRGB(rgb)
Other Band Combinations
Although RGB is the most obvious band combination for Landsat data, the comparatively low resolution (30 meters) severely limits visible light image quality compared to other contemporary high-resolution sources, especially when focusing on localities.
However, data from the eight other infrared and ultraviolet bands can be combined with the visible light bands in a variety of ways to create useful visualizations for biogeography and agriculture.
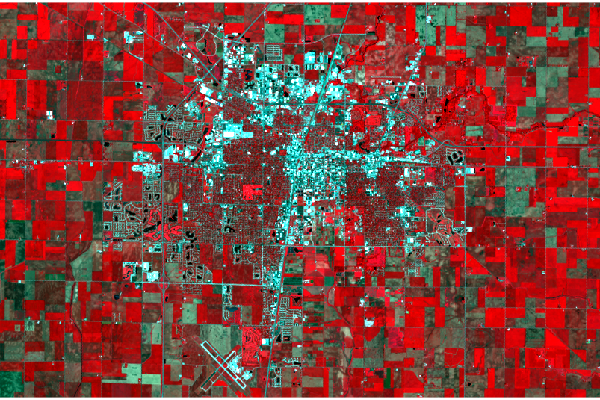
Color Infrared
This visualization colors near-infrared (band 5) as red, red (band 4) as green, and green (band 3) as blue.
Healthy photosynthetic plants reflect infrared light, so helthy vegetation is red, bare or urbanized areas are white, and dark areas are water.
green = raster("LC08_L1TP_023032_20210622_20210629_02_T1_B3.TIF")
red = raster("LC08_L1TP_023032_20210622_20210629_02_T1_B4.TIF")
near.infrared = raster("LC08_L1TP_023032_20210622_20210629_02_T1_B5.TIF")

rgb = stack(near.infrared, red, green)

boundary = raster(ymx=40.17, xmn=-88.38, ymn=40.03, xmx=-88.10)
boundary = projectExtent(boundary, rgb@crs)
rgb = crop(rgb, boundary)

plotRGB(rgb, scale=65535, stretch="lin")
Short-Wave Infrared
This alternative vegetation visualization colors short-wave infrared 2 (band 7) as red, short-wave infrared 1 (band 6) as green, and red(band 4) as blue.
Density of vegetation is indicated by the darkness of the shades of green. Urban areas are blue and soil is brown.
red = raster("LC08_L1TP_023032_20210622_20210629_02_T1_B4.TIF")
sw.infrared.1 = raster("LC08_L1TP_023032_20210622_20210629_02_T1_B6.TIF")
sw.infrared.2 = raster("LC08_L1TP_023032_20210622_20210629_02_T1_B7.TIF")

rgb = stack(sw.infrared.2, sw.infrared.1, red)

boundary = raster(ymx=40.17, xmn=-88.38, ymn=40.03, xmx=-88.10)
boundary = projectExtent(boundary, rgb@crs)
rgb = crop(rgb, boundary)

plotRGB(rgb, scale=65535, stretch="lin")

NDVI
The Landsat multispectral data is of considerable value for the remote sensing of the environment.
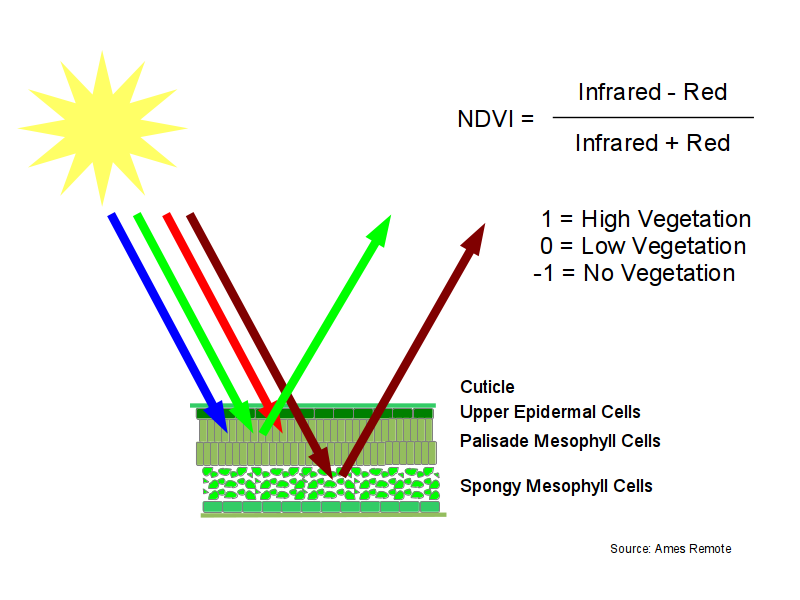
Normalized Difference Vegetation Index (NDVI) is a calculated set of values between negative one and positive one that indicate the level of photosynthetic vegetation. NDVI is calculated by combining the red and near infrared bands using the following formula:
NDVI = (infrared - red) / (infrared + red)
NDVI is based on the observation that green plants reflect infrared light (to avoid overheating), but absorb visible light (to power photosynthesis). This gives green plants a light reflection signature that can distinguish them from objects that absorb all spectra of light or different spectra of light from plants.
While you could use the level of green light to detect green (photosynthetic) plants, the level of green light depends on the intensity and angle of the sun relative to the terrain. The use of this combination of red and near-infrared gives measurements that are normalized to be the consistent across time and space regardless of terrain or level of lighting.
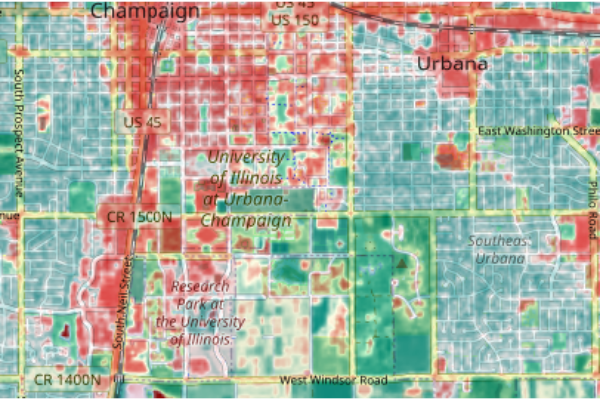
Creating an NDVI Raster
Rasters with the same extents and pixel dimensions can be used in mathematical operations like vectors or matrices. This is called raster algebra.
In this example:
- The raster() calls load the red and near.infrared band files.
- raster() is also used to create an extent for cropping and projectExtent() reprojects that extent to the projection and resolution used by the Landsat data.
- The crop() function crops the red and near infrared rasters to the extent defined for the desired boundary.
- The NDVI formula is used in raster algebra to create a new NDVI raster.
- The colorRampPalette() is used to define 255 colors that are then passed with the raster to plot() a visualization of the NDVI raster.
red = raster("LC08_L1TP_023032_20210622_20210629_02_T1_B4.TIF")
near.infrared = raster("LC08_L1TP_023032_20210622_20210629_02_T1_B5.TIF")

boundary = raster(ymx=40.17, xmn=-88.38, ymn=40.03, xmx=-88.10)
boundary = projectExtent(boundary, red@crs)

red = crop(red, boundary)
near.infrared = crop(near.infrared, boundary)

ndvi = (near.infrared - red) / (near.infrared + red)

colors = colorRampPalette(c("red3", "white", "darkcyan"))(255)

plot(ndvi, zlim=c(0, 0.6), col=colors)
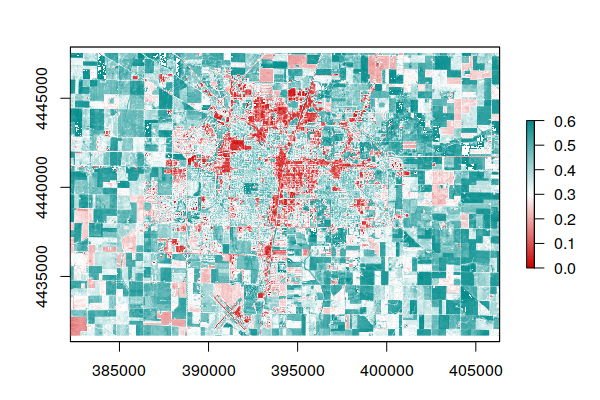
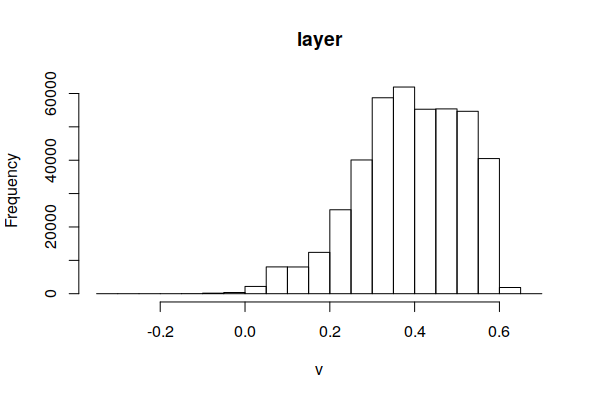
The range of NDVI is -1 to +1, although NDVI values will generally be in a small area in the middle of the full potential range of -1 to +1. You can use this information to adjust the zlim parameter to distribute the color values and make them legible.
hist(ndvi)
Blending with a Base Map For Context
Since the objective of NDVI analysis is usually to know what is going on at a specific location or set of locations, it can be helpful to plot NDVI with a base map that gives geographic context to the data:
- A raster() call converts the OpenStreetMap tiles to an RGB RasterStack.
- projectRaster() crops and reprojects the red and near infrared rasters so they are in the same format as the base map.
- The red and near infrared are converted to NDVI using the formula given above.
- The RGB() function converts the single-band NDVI raster to a three-band RGB rasterStack using the 255 colors defined with colorRampPalette().
- The base map and colored NDVI stacks are divided by 255 (so their range is 0 to 1) and multplied to blend the colors together.
- Finally, the blended stack is plotted to output device using plotRGB(). The scale=1 reflects that the values are 0 to 1, and the interpolate=T parameter smooths the pixels together for display.
Sys.setenv(NOAWT=1)

library(OpenStreetMap)

upperLeft = c(40.1171, -88.26)
lowerRight = c(40.0817, -88.19)
basemap = openmap(upperLeft, lowerRight, zoom=13)
basemap = raster(basemap)

red = raster("LC08_L1TP_023032_20210622_20210629_02_T1_B4.TIF")
near.infrared = raster("LC08_L1TP_023032_20210622_20210629_02_T1_B5.TIF")

red = projectRaster(red, basemap)
near.infrared = projectRaster(near.infrared, basemap)

ndvi = (near.infrared - red) / (near.infrared + red)

colors = colorRampPalette(c("red3", "white", "darkcyan"))(255)

ndvi = RGB(ndvi, col=colors)

blended = (basemap / 255.0) * (ndvi / 255.0)

plotRGB(blended, scale=1, interpolate=1)
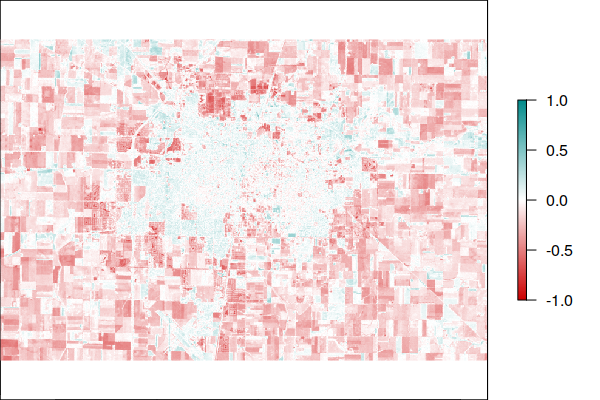
Analyzing NDVI Change
The same type of raster algebra used to calculate NDVI can be used to calculate changes in NDVI between scenes.
When looking for a scene for for comparison a different date, it is important that you use an image from the same path and row. Although Landsat scenes overlap, using the same path and row will maximize the amount of common area and, therefore the amount of area covered in the analysis.
This example displays changes in NDVI in Champaign-Urbana, IL between the 1984 Landsat 5 scene and the 2021 Landsat 8 scene.
While the urbanized areas seem largely unchanged, the surrounding area has noticeably lower NDVI, which reflects both the construction of residential developments on the edge of the city (sprawl), and may reflect decreased agricultural intensity in the areas around Champaign-Urbana, which is noticeable by comparing the visible light visualizations above. However, this may also reflect differences in the sensor hardware.
- The raster() and crop() function calls create the 2021 rasters and crop them to the desired area for viewing.
- The second set of raster() calls creates the 1984 rasters, and the projectRaster() calls crop and align them with the 2021 rasters.
- A raster with difference between the 2021 and 1984 NDVI rasters can be created by subtracting the 1984 raster from the 2021 raster.
red = raster("LC08_L1TP_023032_20210622_20210629_02_T1_B4.TIF")
near.infrared = raster("LC08_L1TP_023032_20210622_20210629_02_T1_B5.TIF")

boundary = raster(ymx=40.17, xmn=-88.38, ymn=40.03, xmx=-88.10)
boundary = projectExtent(boundary, red@crs)

red = crop(red, boundary)
near.infrared = crop(near.infrared, boundary)

ndvi.2021 = (near.infrared - red) / (near.infrared + red)

red = raster("LT05_L1TP_022032_19840828_20200918_02_T1_B3.TIF")
near.infrared = raster("LT05_L1TP_022032_19840828_20200918_02_T1_B4.TIF")

red = projectRaster(red, ndvi.2021)
near.infrared = projectRaster(near.infrared, ndvi.2021)

ndvi.1984 = (near.infrared - red) / (near.infrared + red)

ndvi.difference = ndvi.2021 - ndvi.1984

colors = colorRampPalette(c("red3", "white", "darkcyan"))(255)

plot(ndvi.difference, col=colors, zlim=c(-1, 1))
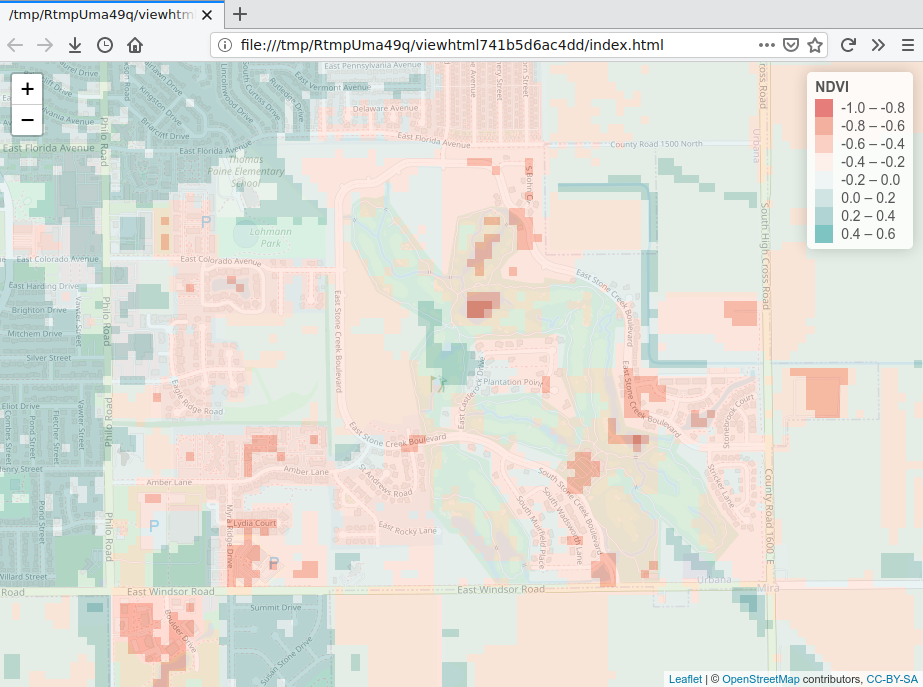
Interactive Display with Leaflet
When exploring data, it can be helpful to have an interactive visualization that you can zoom and pan. You can either export your data to a web service like ArcGIS Online or use an library like Leaflet for R that provides a similar level of interactivity on your desktop.
If you haven't already, you can install the Leaflet for R library with install.packages().
install.packages("leaflet")
The following script will create an interactive map using the NDVI change raster and open it in a new browser window. Note that unless you publish this map to a web server, it will only be available to you on your personal machine, and cannot be embedded into a notebook.
- leaflet() creates the map.
- addTiles() adds a base map to the map using OpenStreetMap tiles.
- colorNumeric() creates a color palette that Leaflet can use.
- addRasterImage() add the raster layer to the map along with the palette used to color it. The opacity=0.7 parameter makes the map semitransparent so you can see the base map features for context.
- addLegend() adds a legend so you know what numeric values the colors represent.
library(leaflet)

map = leaflet()

map = addTiles(map)

palette = colorBin(c("red3", "white", "darkcyan"), values(ndvi.difference))

map = addRasterImage(map, ndvi.difference, palette, opacity=0.7)

map = addLegend(map, pal=palette, values=values(ndvi.difference), title="NDVI")

map
NDVI vs. Demographics
Vegetation (especially trees) is often associated with residential areas that are both more attractive and more healthful places to live (Visram 2021). Tree cover reduces summer street temperatures and promotes the presence of birds (Rubiano 2020).
There is a commonly cited relationship between neighborhood affluence and levels of vegetation that has been referred to as a luxury effect (Leong, Dunn, and Trautwein 2018) or tree gap (Visram 2021). Residential tree cover is considered a matter of environmental justice (Leahy and Serkez 2021), and American Forests' Tree Equity Score tracks the tree cover as critical infrastructure.
While NDVI does not clearly distinguish trees from grasses, levels of different types of vegetation tend to correlate in space, so NDVI can be used to assess the relationship between neighborhood greenness and demographics.
Load County Census Tracts
For this example, we will use demographic data from the US Census Bureau's 2015-2019 American Community Survey five-year estimates. A GeoJSON file of that data for census tracts in Illinois is available here.
- That GeoJSON file can be loaded into R with the st_read() file from the Simple Features (sf) package, and then displayed with the plot() function.
- This analysis will focus on Champaign County, IL. The subsetting line selects only tracts with a FIPS code that begins with the FIPS code for Champaign County (17019). The grepl() function subsets rows by returning TRUE for every FIPS field value that begins with the county FIPS code.
- We plot() median household income as a common demographic variable used for neighborhood affluence.
library(sf)

tracts = st_read("2015-2019-acs-il_tracts.geojson", stringsAsFactors=F, quiet=T)

tracts = tracts[grepl("^17019", tracts$FIPS),]

plot(tracts["Median.Household.Income"], breaks="jenks",
	pal=colorRampPalette(c("red3", "white", "darkcyan")))

To filter other counties in Illinois, below are the FIPS codes for the top 14 Illinois counties by population.
- Cook (Chicago): 17031
- DuPage (Naperville): 17043
- Lake (Waukegan): 17097
- Will (Joliet): 17197
- Kane (Aurora): 17089
- McHenry (Crystal Lake): 17111
- Winnebago (Rockford): 17201
- Madison (Granite City):17119
- St. Clair (Belleville): 17163
- Champaign (Champaign): 17019
- Sangamon (Springfield): 17167
- Peoria (Peoria): 17143
- McLean (Bloomington): 17113
- Rock Island (Moline): 17161
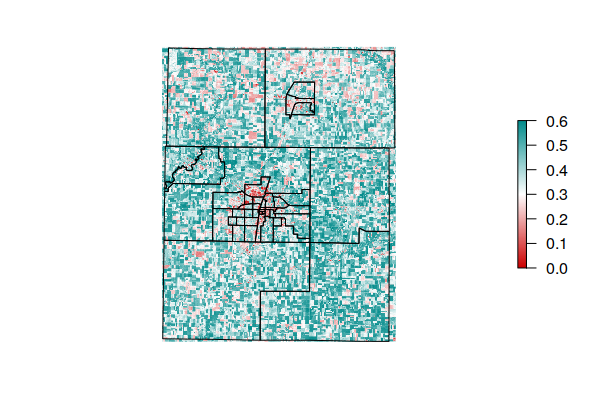
Calculate County NDVI
NDVI is calculated using the same technique described above. For this example, we crop the rasters to the area occupied by all Champaign County tracts.
library(raster)

red = raster("LC08_L1TP_023032_20210622_20210629_02_T1_B4.TIF")
near.infrared = raster("LC08_L1TP_023032_20210622_20210629_02_T1_B5.TIF")

boundary = raster(as_Spatial(tracts))
boundary = projectExtent(boundary, red@crs)

red = crop(red, boundary)
near.infrared = crop(near.infrared, boundary)

ndvi = (near.infrared - red) / (near.infrared + red)

tracts = st_transform(tracts, st_crs(red))

colors = colorRampPalette(c("red3", "white", "darkcyan"))(255)

plot(ndvi, zlim=c(0, 0.6), col=colors, interpolate=T, axes=F, box=F)

plot(st_geometry(tracts), add=T)
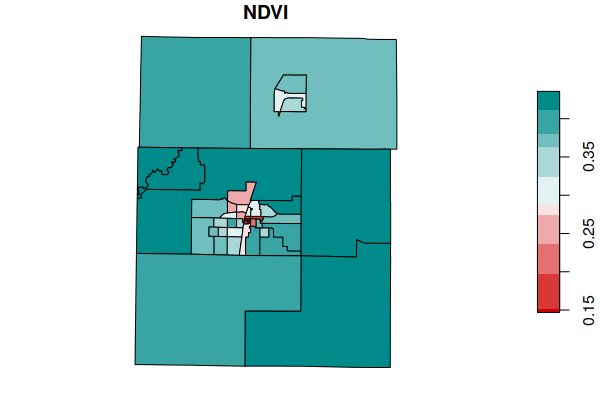
Extract Mean NDVI for Each Tract
When used with a set of polygons like the tract polygons, the extract() function from the raster package finds all raster values covered by each polygon and combines them using the function specified with the fun parameter. For this example we will take the mean of all NDVI values within each tract.
tracts$NDVI = extract(ndvi, as_Spatial(tracts), fun=mean, na.rm=T)

plot(tracts["NDVI"], breaks="quantile",
	pal=colorRampPalette(c("red3", "white", "darkcyan")))
Save Tract Data
In order to preserve your processed data for future analysis, you may want to save it to a new GeoJSON file. The tracts need to be transformed back into the WGS 84 latitudes and longitudes (WKID EPSG 4326) normally used in GeoJSON files.
tracts = st_transform(tracts, 4326)

st_write(tracts, "2021-minn-champaign-ndvi.geojson", delete_dsn=T)
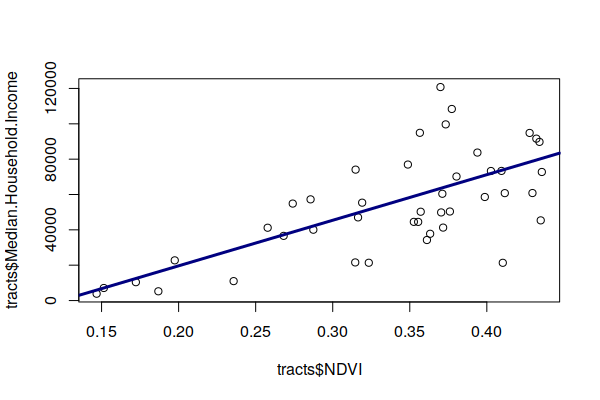
Correlate NDVI and Median Household Income
Plotting income against NDVI, we see a fairly strong luxury effect in Champaign County, IL.
plot(tracts$NDVI, tracts$Median.Household.Income)

model = lm(NDVI ~ Median.Household.Income, weights=Total.Population, data=tracts)

abline(model, lwd=3, col="navy")

summary(model)

	Weighted Residuals:
	   Min     1Q Median     3Q    Max
	-6.967 -3.700  0.827  3.039  8.058

	Coefficients:
				 Estimate Std. Error t value Pr(>|t|)
	(Intercept)             2.338e-01  1.909e-02  12.247 2.78e-15 ***
	Median.Household.Income 1.937e-06  3.023e-07   6.409 1.13e-07 ***
	---
	Signif. codes:  0 ‘***’ 0.001 ‘**’ 0.01 ‘*’ 0.05 ‘.’ 0.1 ‘ ’ 1

	Residual standard error: 3.909 on 41 degrees of freedom
	Multiple R-squared:  0.5004,    Adjusted R-squared:  0.4882
	F-statistic: 41.07 on 1 and 41 DF,  p-value: 1.135e-07
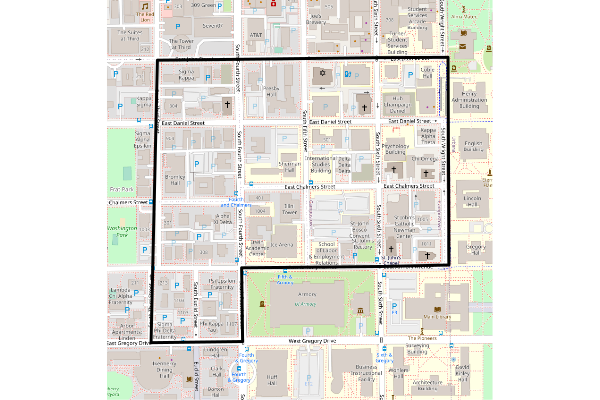
Visualize Tracts
To get geographic context for the low NDVI tract, we order() the tracts by mean NDVI, take the first feature, create an OpenStreetMap base map for the area covered by the bounding box, and overlay the outline of the tract.
This low NDVI tract is the barren student ghetto (Campustown) to the west of the University of Illinois campus.
tracts = tracts[order(tracts$NDVI),]

low.tract = tracts[1,]

Sys.setenv(NOAWT=1)

library(OpenStreetMap)

bbox = st_bbox(st_buffer(st_transform(low.tract, 4326), 0.001))
upperLeft = bbox[c("ymax", "xmin")]
lowerRight = bbox[c("ymin", "xmax")]

basemap = openmap(upperLeft, lowerRight)

plot(basemap)

plot(st_geometry(st_transform(low.tract, 3857)), lwd=3, add=T)
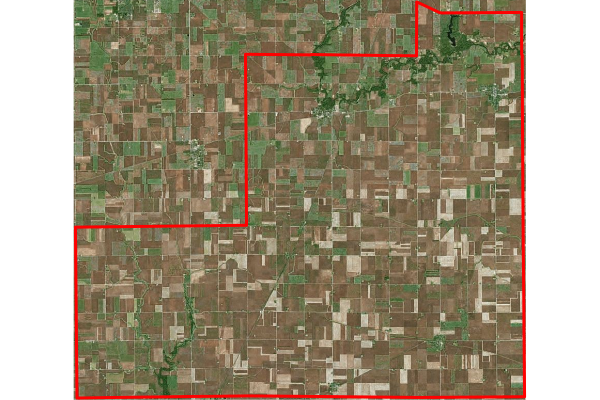
The high NDVI tract can be visualized by reversing the sort. In this case, we use an aerial imagery from Bing as the basemap.
As might be expected, this is a sparsely-populated rural agricultural area in the southeast corner of the county.
tracts = tracts[order(tracts$NDVI, decreasing=T),]

high.tract = tracts[1,]

Sys.setenv(NOAWT=1)

library(OpenStreetMap)

bbox = st_bbox(st_buffer(st_transform(high.tract, 4326), 0.001))
upperLeft = bbox[c("ymax", "xmin")]
lowerRight = bbox[c("ymin", "xmax")]

basemap = openmap(upperLeft, lowerRight, type="bing")

plot(basemap)

plot(st_geometry(st_transform(high.tract, 3857)), lwd=3, border="red", add=T)
Multiple Regression
A question we might ask would be, what mechanism ties income and neighborhood vegetation together?
- Is vegetation an amenity that attracts wealthy residents?
- Do wealthier people actively plant more vegetation?
- Are wealthier people able to afford more vegetation?
- Are places with older populations both more wealthy and filled with older houses, which would be more likely to be surrounded by mature trees, compared to places where less wealthy young families live in newer homes?
- Is vegetation simply a function of population density, where wealthier people can live on larger lots, which will have more vegetation?
To examine these questions, we can create a multiple regression model which considers additional variables that we hypothesize may be significant.
The results show that when population density (Pop.per.Square.Mile) is considered, it becomes significant, while median household income falls to the wayside. The percentage of homeowners is also presumably related since home ownership in this part of the state usually means a single family home on a lot with a lawn and trees, compared to renters (especially students) who live in dense, multi-family housing units with less surrounding vegetation.
This hints that the correlation between income and NDVI (at least in this part of the state) is indirect. The more money you have, the more space you can afford to occupy, and the more space you occupy, the more you will be surrounded by vegetation. However, this relationship is confounded in a largely low density area like Champaign County, poor people can also afford homes, which makes the income/vegetation relationship less clear than it might be in a more densely populated area.
model = lm(NDVI ~ Median.Household.Income + Pop.per.Square.Mile +
	Median.Age + Percent.Pre.War.Units + Percent.Homeowners +
	Percent.Bachelors.Degree, weights=Total.Population, data=tracts)

summary(model)

	Coefficients:
				   Estimate Std. Error t value Pr(>|t|)
	(Intercept)               2.678e-01  4.127e-02   6.488 1.55e-07 ***
	Median.Household.Income  -8.987e-07  6.107e-07  -1.472 0.149795
	Pop.per.Square.Mile      -4.081e-06  8.961e-07  -4.555 5.80e-05 ***
	Median.Age               -3.266e-04  1.413e-03  -0.231 0.818572
	Percent.Pre.War.Units    -1.750e-04  4.854e-04  -0.360 0.720592
	Percent.Homeowners        2.324e-03  6.482e-04   3.585 0.000992 ***
	Percent.Bachelors.Degree  1.775e-03  1.147e-03   1.548 0.130356

---
	Signif. codes:  0 ‘***’ 0.001 ‘**’ 0.01 ‘*’ 0.05 ‘.’ 0.1 ‘ ’ 1

	Residual standard error: 2.767 on 36 degrees of freedom
	Multiple R-squared:  0.7811,    Adjusted R-squared:  0.7446
	F-statistic: 21.41 on 6 and 36 DF,  p-value: 1.592e-10
Multicollinearity
An issue with the aforementioned interpretation of the model results is that multiple regression assumes the independent variables are, indeed, independent and not correlated. The presence of correlation in explanatory variables is called multicollinearity.
While multicollinearity will not affect model fit, it can make model parameters ambiguous and cause coefficients to be marked as statistically insignificant even though their presence improves model fit (Ghosh 2017).
The imcdiag() function from the mctest library can be used to perform multiple tests on the model to identify multicollinearity.
library(mctest)

model = lm(NDVI ~ Median.Household.Income + Pop.per.Square.Mile +
        Median.Age + Percent.Pre.War.Units + Percent.Homeowners +
        Percent.Bachelors.Degree, weights=Total.Population, data=tracts)

imcdiag(model)

	All Individual Multicollinearity Diagnostics Result

				    VIF    TOL      Wi      Fi Leamer    CVIF Klein
	Median.Household.Income  7.7600 0.1289 50.0239 64.2198 0.3590 -1.6275     1
	Pop.per.Square.Mile      2.1322 0.4690  8.3781 10.7557 0.6848 -0.4472     0
	Median.Age               3.9510 0.2531 21.8375 28.0347 0.5031 -0.8286     0
	Percent.Pre.War.Units    1.1029 0.9067  0.7618  0.9779 0.9522 -0.2313     0
	Percent.Homeowners       8.8169 0.1134 57.8449 74.2603 0.3368 -1.8491     1
	Percent.Bachelors.Degree 1.9967 0.5008  7.3758  9.4689 0.7077 -0.4188     0
				   IND1   IND2
	Median.Household.Income  0.0174 1.4406
	Pop.per.Square.Mile      0.0634 0.8781
	Median.Age               0.0342 1.2352
	Percent.Pre.War.Units    0.1225 0.1543
	Percent.Homeowners       0.0153 1.4662
	Percent.Bachelors.Degree 0.0677 0.8255

	1 --> COLLINEARITY is detected by the test
	0 --> COLLINEARITY is not detected by the test

	Median.Household.Income , Median.Age , Percent.Pre.War.Units ,
	Percent.Bachelors.Degree , coefficient(s) are non-significant may be due to
	multicollinearity
VIF (variance inflation factor) can be used to identify independent variables
that are strongly predicted by other independent variables and are, therefore, correlated
with at least one of those variables.
To remove the multicollinearity, successively remove the variables with the highest VIF until all VIF values are at least below five and, preferably, below 2.5 (Choueiry 2021).
In this case Median.Household.Income and Percent.Homeowners are flagged as collinear and removing them drops the VIF values to acceptable levels.
model = lm(NDVI ~ Pop.per.Square.Mile + Median.Age + Percent.Pre.War.Units +
	Percent.Bachelors.Degree, weights=Total.Population, data=tracts)

imcdiag(model)

	All Individual Multicollinearity Diagnostics Result

				    VIF    TOL     Wi      Fi Leamer     CVIF Klein
	Pop.per.Square.Mile      1.5860 0.6305 7.6174 11.7191 0.7941 -10.7487     0
	Median.Age               1.3766 0.7264 4.8957  7.5319 0.8523  -9.3298     0
	Percent.Pre.War.Units    1.0204 0.9800 0.2648  0.4074 0.9900  -6.9155     0
	Percent.Bachelors.Degree 1.1878 0.8419 2.4409  3.7552 0.9176  -8.0500     0
				   IND1   IND2
	Pop.per.Square.Mile      0.0485 1.7999
	Median.Age               0.0559 1.3327
	Percent.Pre.War.Units    0.0754 0.0972
	Percent.Bachelors.Degree 0.0648 0.7701

	1 --> COLLINEARITY is detected by the test
	0 --> COLLINEARITY is not detected by the test

	Percent.Pre.War.Units , Percent.Bachelors.Degree , coefficient(s) are
	non-significant may be due to multicollinearity

	R-square of y on all x: 0.6755

summary(model)

	Weighted Residuals:
	    Min      1Q  Median      3Q     Max
	-5.8128 -2.4011  0.2137  2.3086  5.3079

	Coefficients:
				   Estimate Std. Error t value Pr(>|t|)
	(Intercept)               2.292e-01  4.401e-02   5.207 6.93e-06 ***
	Pop.per.Square.Mile      -4.680e-06  8.759e-07  -5.343 4.53e-06 ***
	Median.Age                3.382e-03  1.012e-03   3.342  0.00188 **
	Percent.Pre.War.Units     1.931e-04  5.380e-04   0.359  0.72159
	Percent.Bachelors.Degree  9.499e-04  1.036e-03   0.917  0.36511
	---
	Signif. codes:  0 ‘***’ 0.001 ‘**’ 0.01 ‘*’ 0.05 ‘.’ 0.1 ‘ ’ 1

	Residual standard error: 3.216 on 38 degrees of freedom
	Multiple R-squared:  0.6879,    Adjusted R-squared:  0.655
	F-statistic: 20.94 on 4 and 38 DF,  p-value: 3.468e-09
Removing the statistically insigificant variables leaves only population density and median age in the model, which still has an R2 indicating a fairly good fit.
model = lm(NDVI ~ Pop.per.Square.Mile + Median.Age,
	weights=Total.Population, data=tracts)

summary(model)

	Call:
	lm(formula = NDVI ~ Pop.per.Square.Mile + Median.Age, data = tracts,
	    weights = Total.Population)

	Weighted Residuals:
	    Min      1Q  Median      3Q     Max
	-5.8593 -2.2126 -0.1498  1.8970  5.7040

	Coefficients:
			      Estimate Std. Error t value Pr(>|t|)
	(Intercept)          2.526e-01  3.666e-02   6.891 2.66e-08 ***
	Pop.per.Square.Mile -4.455e-06  8.109e-07  -5.494 2.43e-06 ***
	Median.Age           3.352e-03  9.918e-04   3.380  0.00163 **
	---
	Signif. codes:  0 ‘***’ 0.001 ‘**’ 0.01 ‘*’ 0.05 ‘.’ 0.1 ‘ ’ 1

	Residual standard error: 3.152 on 40 degrees of freedom
	Multiple R-squared:  0.6832,    Adjusted R-squared:  0.6673
	F-statistic: 43.12 on 2 and 40 DF,  p-value: 1.04e-10


imcdiag(model)

	All Individual Multicollinearity Diagnostics Result

			       VIF    TOL      Wi  Fi Leamer      CVIF Klein   IND1
	Pop.per.Square.Mile 1.3646 0.7328 14.9482 Inf  0.856 -137.1094     0 0.0179
	Median.Age          1.3646 0.7328 14.9482 Inf  0.856 -137.1094     0 0.0179
			    IND2
	Pop.per.Square.Mile    1
	Median.Age             1

	1 --> COLLINEARITY is detected by the test
	0 --> COLLINEARITY is not detected by the test

	* all coefficients have significant t-ratios

	R-square of y on all x: 0.6686
Principal Component Analysis
In dealing with multicollinearity above, our approach was to simply remove correlated variables from our model. However, in eliminating variables, we may have also removed important information. We also cannot know whether variables we never chose not to include could have been significant.
One technique for addressing those issues is principal component analysis (PCA), which uses linear algebra to reduce a matrix of all the possible variables to a smaller set of principal component variables. When used as part of factor analysis, PCA is used to find relationships between observed, correlated variables that point to unobserved variables (called factors or latent variables) that explain the broader relationships (Majumdar 2018).
This reduction in the number of variables (dimensions) needed for analysis is called dimensionality reduction. Because this technique makes a determination of the importance of different variables without direct human intervention or judgement, PCA can also be considered a form of unsupervised machine learning.
For this example, we use a set of census tract demographic variables that we hypothesize may affect NDVI, but which we have observed above as being correlated. These variables are passed as the right side of a formula to the prcomp() function.
The print() of the output of the prcomp() function lists the calculated principal components along the top (PC1 - PC6) along with the percent of each variable that contributes to that component. These can be interpreted to infer patterns of relationships that hint at latent variables.
- PC1 draws strongly on income, age, and home ownership, which might broadly be considered a wealth component.
- PC2 draws strongly on percent of residents with bachelor's degrees, which may make it an education component.
- PC3 draws strongly on the percent of pre-war (built before 1940) building, which may make it a building age component.
- PC4 seems to be a population density component.
- PC5 seems to be an age component.
- PC6 draws on income and the inverse of home ownership, which may represent a high income renters component.
pca = prcomp(~ Median.Household.Income + Pop.per.Square.Mile +
	Median.Age + Percent.Pre.War.Units + Percent.Homeowners +
	Percent.Bachelors.Degree, data=tracts, scale=T)

print(pca)

	Standard deviations (1, .., p=6):
	[1] 1.7817884 1.1120335 0.9529559 0.6684303 0.4106193 0.2551065

	Rotation (n x k) = (6 x 6):
					 PC1         PC2        PC3         PC4
	Median.Household.Income   0.50453008 -0.29820975 0.11966764 -0.09439929
	Pop.per.Square.Mile      -0.42854455 -0.27840409 0.16474412  0.79941428
	Median.Age                0.50489392 -0.12534918 0.03310023  0.42237713
	Percent.Pre.War.Units     0.03034971  0.53816646 0.83838676  0.02159398
	Percent.Homeowners        0.53538904 -0.04247929 0.07006712  0.24128032
	Percent.Bachelors.Degree -0.13899124 -0.72554949 0.49964152 -0.33902899
					  PC5         PC6
	Median.Household.Income  -0.478345209  0.63598320
	Pop.per.Square.Mile      -0.244642283  0.11307993
	Median.Age                0.727370616  0.14423463
	Percent.Pre.War.Units     0.005540119  0.07788716
	Percent.Homeowners       -0.381645934 -0.70906620
	Percent.Bachelors.Degree  0.191268633 -0.23042000
We can test the statistical significance of these principal components as predictors of NDVI by creating a multiple regression model using the lm() function.
The listing of coefficients indicates that the wealth component is the strongest, followed by high income renters, and population density.
pca.data = as.data.frame(predict(pca, st_drop_geometry(tracts)))

pca.data$NDVI = tracts$NDVI

model = lm(NDVI ~ ., data=pca.data)

summary(model)

	Residuals:
	      Min        1Q    Median        3Q       Max
	-0.074877 -0.026456 -0.002282  0.024347  0.107067

	Coefficients:
		      Estimate Std. Error t value Pr(>|t|)
	(Intercept)  0.3385591  0.0063652  53.189  < 2e-16 ***
	PC1          0.0363484  0.0036147  10.056 5.35e-12 ***
	PC2          0.0049857  0.0057917   0.861  0.39502
	PC3         -0.0002518  0.0067585  -0.037  0.97048
	PC4         -0.0241218  0.0096353  -2.503  0.01697 *
	PC5          0.0014034  0.0156850   0.089  0.92920
	PC6         -0.0781579  0.0252465  -3.096  0.00379 **
	---
	Signif. codes:  0 ‘***’ 0.001 ‘**’ 0.01 ‘*’ 0.05 ‘.’ 0.1 ‘ ’ 1

	Residual standard error: 0.04174 on 36 degrees of freedom
	Multiple R-squared:  0.7658,    Adjusted R-squared:  0.7268
	F-statistic: 19.62 on 6 and 36 DF,  p-value: 5.166e-10
Since the principal components still represent spatial data, we should try spatial lag regression to verify that those variables are still significant when compensating for spatial autocorrelation.
Although the p-values for the Liklihood Ratio (LR) test and Asymptotic standard error t-test indicate autocorrelation is significant (both below 0.05), the p-values on the components largely match the significance observed above.
library(spdep)

neighbors = poly2nb(as_Spatial(tracts))

weights = nb2listw(neighbors, zero.policy=T)

model = lagsarlm(NDVI ~ ., data=pca.data, listw=weights, tol.solve=1.0e-30, zero.policy=T)

summary(model)

	Type: lag
	Coefficients: (asymptotic standard errors)
		      Estimate Std. Error z value  Pr(<|z|)
	(Intercept)  0.1431644  0.0441071  3.2458  0.001171
	PC1          0.0207942  0.0039552  5.2575 1.461e-07
	PC2          0.0055409  0.0044463  1.2462  0.212693
	PC3          0.0026783  0.0052533  0.5098  0.610175
	PC4         -0.0172517  0.0074813 -2.3060  0.021111
	PC5          0.0052327  0.0120898  0.4328  0.665145
	PC6         -0.0593586  0.0193892 -3.0614  0.002203

	Rho: 0.57636, LR test value: 11.936, p-value: 0.00055063
	Asymptotic standard error: 0.12802
	    z-value: 4.5021, p-value: 6.7284e-06
	Wald statistic: 20.269, p-value: 6.7284e-06

	Log likelihood: 85.35492 for lag model
	ML residual variance (sigma squared): 0.001023, (sigma: 0.031984)
	Number of observations: 43
	Number of parameters estimated: 9
	AIC: -152.71, (AIC for lm: -142.77)
	LM test for residual autocorrelation
	test value: 10.882, p-value: 0.00097091
Geographically Weighted Regression
The multiple regression model above is a global model that assumes that the relationship between variables is the same across the entire analyzed area (stationarity). However, geographical phenomenon often exhibit geographical heterogeneity where the relationship between variables differs across space. The relationship between NDVI and demographics is such a situation, since differences in land use represent different underlying social relationships.
This spatial heterogeneity can manifest itself in clumping of similar values together (autocorrelation), which can be addressed with spatial lag and error models. However, such models may not clearly identify the heterogeneity that creates the autocorrelation.
One exploratory technique for addressing this issue is geographically weighted regression, which involves creating separate local models across the analyzed area in order to identify changes in variable relationships across space (Bivand 2020, Dennett 2014).
- Geographically weighted regression is implemented in the spgwr library.
- The gwr.sel() function finds the optimal bandwidth of the weighted window (kernel) that is moved across space to differentiate areas.
- The gwr() function runs the geographically weighted regression analysis.
- The as_Spatial() function is used to convert simple features (sf) polygon data in the tracts variable to the older SpatialPolygonsDataFrame data used by the gwr() function.
Listing the model shows quantiles of variation of the coefficients for each of the independent variables. The Global coefficients match the output of the multiple regression model above, and the Quasi-global R2 shows a strong model fit.
library(spgwr)

bandwidth = gwr.sel(NDVI ~ Pop.per.Square.Mile + Median.Age,
	data = as_Spatial(tracts), gweight = gwr.Gauss, verbose = F)

model = gwr(NDVI ~ Pop.per.Square.Mile + Median.Age,
	data = as_Spatial(tracts), bandwidth = bandwidth,
        gweight = gwr.Gauss, hatmatrix = T)

model

	Call:
	gwr(formula = NDVI ~ Pop.per.Square.Mile + Median.Age, data = as_Spatial(tracts),
	    bandwidth = bandwidth, gweight = gwr.Gauss, hatmatrix = T)
	Kernel function: gwr.Gauss
	Fixed bandwidth: 4.936491
	Summary of GWR coefficient estimates at data points:
				   Min.     1st Qu.      Median     3rd Qu.        Max.
	X.Intercept.         1.8330e-01  2.1702e-01  2.3023e-01  2.6946e-01  5.4982e-01
	Pop.per.Square.Mile -8.5260e-05 -4.4926e-06 -3.9012e-06 -3.6555e-06 -3.1905e-06
	Median.Age          -3.6830e-03  2.5436e-03  3.3756e-03  3.7815e-03  5.0784e-03
			    Global
	X.Intercept.        0.2553
	Pop.per.Square.Mile 0.0000
	Median.Age          0.0032
	Number of data points: 43

	Effective number of parameters (residual: 2traceS - traceS'S): 14.53999
	Effective degrees of freedom (residual: 2traceS - traceS'S): 28.46001
	Sigma (residual: 2traceS - traceS'S): 0.04342325
	Effective number of parameters (model: traceS): 12.39761
	Effective degrees of freedom (model: traceS): 30.60239
	Sigma (model: traceS): 0.04187571
	Sigma (ML): 0.03532691
	AICc (GWR p. 61, eq 2.33; p. 96, eq. 4.21): -125.1956
	AIC (GWR p. 96, eq. 4.22): -153.0812
	Residual sum of squares: 0.05366358
	Quasi-global R2: 0.7990242
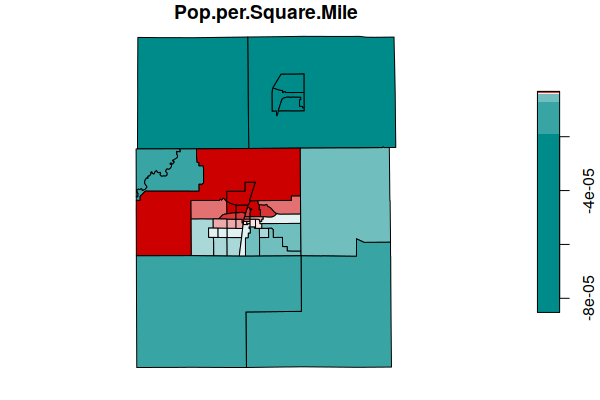
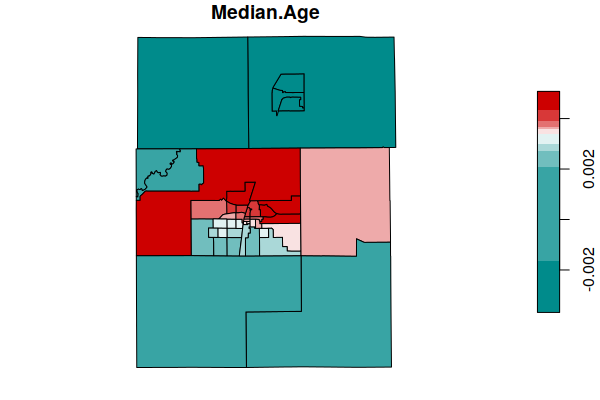
The SDF element of the model object is a spatial data frame (SpatialPolygonsDataFrame) that contains the coefficient estimates for the different areas. A plot() of the coefficiencts shows areas where the variables have more or less influence on the predicted values of the dependent variable (NDVI).
Both of these demographic variables have more influence in the urbanized areas of the cities of Champaign and Urbana (in the center of the map), and less influence in the surrounding rural areas.
coefficients = st_as_sf(model$SDF)

plot(coefficients["Pop.per.Square.Mile"], breaks="quantile",
	pal=colorRampPalette(c("darkcyan", "white", "red3")))

plot(coefficients["Median.Age"], breaks="quantile",
	pal=colorRampPalette(c("darkcyan", "white", "red3")))
If gwr() returns a "new data matrix rows mismatch" error, check your data for missing (NA) values.