Visualizing Terrain in ArcGIS Pro
Rev. 3 November 2023
This tutorial covers a variety of ways of visualizing terrain via digital elevation models (DEM) using ArcGIS Pro.
- Data Models
- Acquire the Data
- Start the Map
- Symbolize the Data: Two-Dimensional Maps
- Symbolize the Data: Perspective Maps
- Present the Map
- Save the Project
Data Models
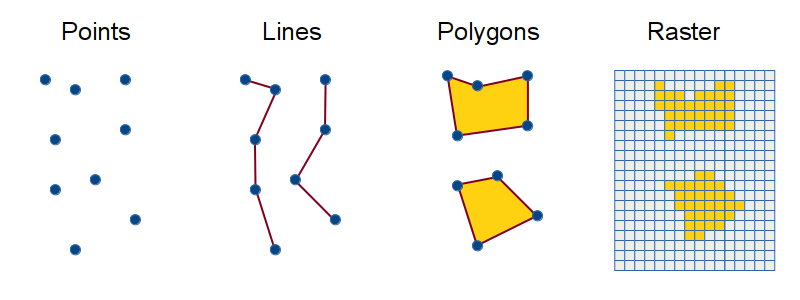
Traditionally, there have been two data models that have been used to represent the surface of the earth as geospatial data: the vector model and the raster model. They are referred to as models because they are abstract simplifications of the world that can be useful for analysis and visualization.
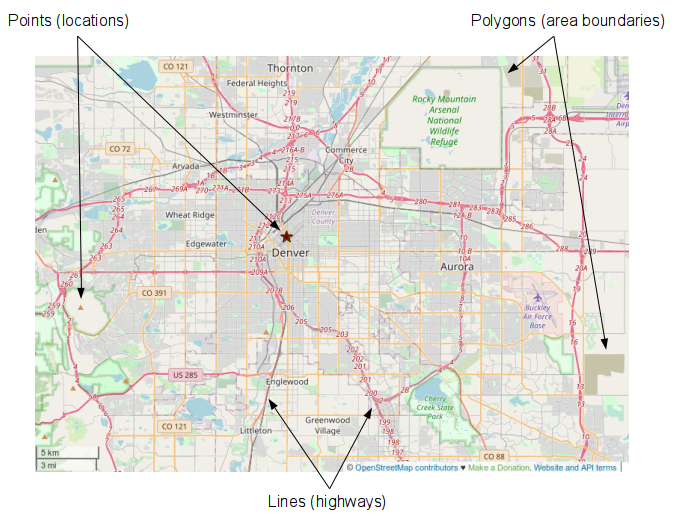
Vector data stores locations as discrete geometric objects: points, lines or polygons.
- Points are represented with a single coordinate pair (latitude and longitude). Points useful for representing objects like vehicles or smartphone locations that occupy little or no area
- Polygons are represented with a collection of coordinate pairs that define the outside boundary of an area. Polygons are useful for representing things like property boundaries or city boundaries that define an area
- Lines are represented by a sequence of coordinate pairs. Lines are useful for representing things like roads or paths that are long and narrow
The raster model represents the world as rows and columns of evenly spaced pixels. The raster model is most useful for representing characteristics of areas that do not have clear boundaries, such as vegetation or other environmental features.
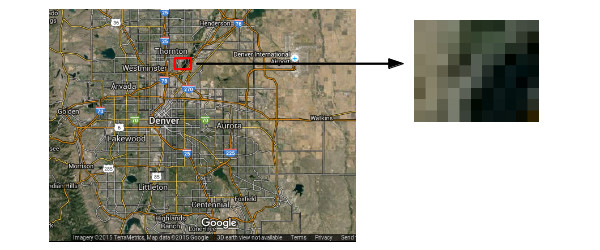
Raster data can be converted to vector data, and vice versa, but the conversion are imprecise and can introduce inaccuracies.
The choice of which model to use depends on what you want to do with your data and different models can be used for the same features. For example, if you are making a web map of stores:
- Points might be useful if you just want people to be able to get driving directions.
- If you are working in real estate, polygons that outline the area occupied by the buildings or property lines might be more useful.
- If you are doing analysis of the environmental effects of those buildings on summer air temperature in the area, rasters might be most useful.
Digital Elevation Models
One common use for the raster model is elevation data, which is the height of an area above some reference surface, such as mean sea level, or a geoid. While terrain can be stored as vectors (triangular irregular networks or TIN), rasters are a simple, effective way to store the irregular physical features of an area of land (terrain).
Digital elevation models (DEMs) are raster data sets containing rows and columns of pixels, where each pixel represents the elevations at a specific location on the surface of the earth. Elevation data is useful in a variety of fields like geology, hydrology, biology, civil engineering, urban planning, transportation, and disaster management.
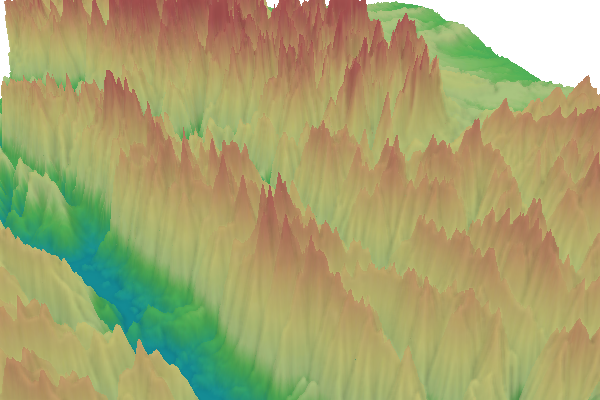
Although DEMs are often rendered in perspective views that give a three-dimensional appearance, DEMs are considered to be 2.5-D rather than 3-D because they only have one possible elevation value for each lat/long pixel. True 3-D requires the ability to model multiple values at each lat/long, such as caves in hills or multiple floors of buildings.
Because DEMs do not have a color of their own, they are visualized in false color with exaggerated height values to make the elevation changes clearer and to give like the visualizations more aesthetic appeal.
DEMs can be created by interpolating elevation data that has been gathered using the traditional survey techiques that have been used to collect elevation data for hundreds of years. But, contemporary remote sensing techniques using data gathered with aerial and space vehicles is much more accurate.
One elevation dataset made freely available to the general public by the federal US Geological Survey is the Shuttle Radar Topography Mission (SRTM). This was data gathered by instruments flown on the US space shuttle Endeavour on February 11 - 22, 2000, and covers almost the entire globe.
Acquire the Data
Remotely sensed data from satellites is often divided into scenes that cover specific areas and can be easily managed. Scenes from the USGS are made available in a number of formats. The GeoTIFF (tagged interface file format) is commonly used and works with a variety of different software, including ArcGIS Pro.
SRTM scenes can be downloaded from the US Geological Survey's EarthExplorer web site.
In order to download data, you need to register (for free). Click the Login button and select Create New Account.
Once you have registered, you can log in and download SRTM data for specific areas.
- Search for a location with the city name and state.
- Click on the desired location in the results list. For this example, we will look the area around Grand Tower, IL on the Mississippi River south of Cape Girardeau.
- Click Data Sets
- Select Digital Elevation -> SRTM -> SRTM Void Filled
- Click Results
- If you have multiple results, click the Show Browse Overlay icon by each result to find the scene that best covers your area of interest.
- If you have a choice between one and three arc-second options, 1-ARC has higher resolution that will give a clearer visualization, but 3-ARC will be faster to work with, especially if you are on a system with limited memory.
- Click the download icon.
- Select the GeoTIFF download format. This request may take a few minutes to process.
- When the file is available, chose the option to Save it.
- In the Windows Explorer, view your downloads directory. The download may take a minute or more, so wait until the temporary .part file goes away before proceeding.
DEM Metadata
Metadata gives information about a geospatial data set such as the date represented and the dimensions of the area covered. To view the metadata for a scene, click the metadata icon.
Start the Map
- Create a new project and give it a meaningful name.
- Add Data to your map with the GeoTIFF file.
- When asked to Build pyramids, this is optional. Pyramids are an internal representation of the raster data that can improve the responsiveness of the software when working with large data sets. It may take up to a minute to complete this operation.
- The SRTM data is in unpojected WGS 1984 format, which stretches areas in North America to appear wider than they are. Change projection to appropriate state plane coordinate system or to WGS 1984 Web Mercator if you anticipate using this data in a web map.
Symbolize The Data: Two-Dimensional Maps
Shaded Relief
A relief map is a map that represents the three-dimensional world (Wikipedia 2020). When created as two-dimensional maps, relief maps give the illusion of being three-dimensional by using hillshading, which shows areas of brightness and shadows as if the terrain were lit from the side. Elevation is usually exaggerated to make the changes in elevation clearer than they would be if presented exactly as they would appear in a birds-eye view of the landscape.
A false color symbology can make the visualization more descriptive and appealing. As with all maps, caution should be used in presentation since false color can exaggerate or create a misimpression of what is actually on the ground.
ArcGIS Pro has a variety of color schemes designed for elevation. This video shows a how to create a shaded relief false color visualization.
- Right click on the map in the Contents panel, select Properties and General, and change the Name to something meaningful.
- Under the Imagery tab, select Raster Functions.
- Scroll to the bottom of the Raster Functions pane to the list of Surface tools.
- Select Shaded Relief.
- Change the Raster to the DEM.
- Select the color ramp of your choice. For this riverfront area, the blue / brown ramp clearly shows higher and lower elevations while not being overly dramatic.
- Create new layer.
Contour Lines
One classical way of visualizing elevation on two-dimensional maps is the use of contour lines that denote locations where the elevation crosses given intervals of elevation, such as 100 feet, 200 feet, 300 feet. In that example, the interval between contour lines is 100 feet.
Topographic maps with contour lines are used by civil engineers and planners when designing structures and communities. Contour lines are also used by hikers to plan routes.
The Contour tool creates contour lines that are line features that can be symbolized and labeled more carefully than the contour raster function.
- Under Analysis open the Tools and search for the Contour tool.
- The Input Raster should be your DEM.
- The Output Feature Class is where the contour lines will be placed. Leaving the default name and changing it later is probably the safest choice.
- The Contour Interval will depend on how varied the topography is in your raster, what you are going to be using the contour lines for, and how close you want the contour lines to be to each other. You may need to make multiple attempts to find a number that gives contour lines that are not too dense to read, but not too sparse to be useful. For this example with bluffs along the Mississippi River we use 50 meter contour interval.
- Run the tool.
- Add labels.
- Change the placement to Centered Straight and add a light gray Halo.
Change the line color to stand out over the relief map.
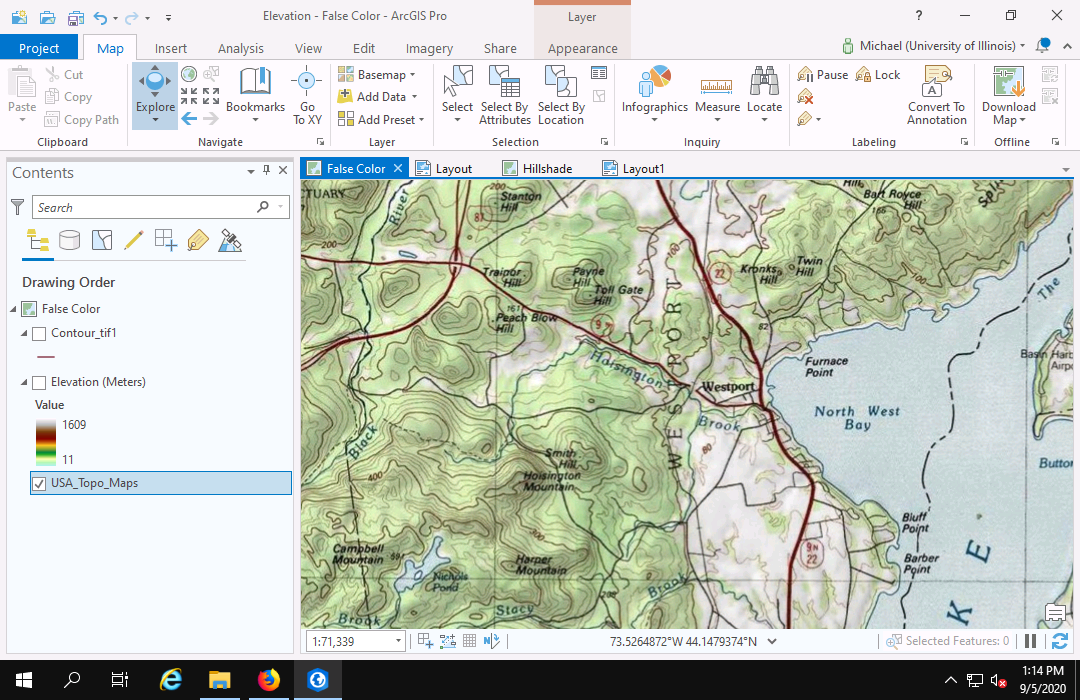
Contour lines are commonly used on topographical maps, such as those that have been produced by the US Geological Survey since the late 19th century. The layout of professional-quality topographical maps is a complex art that requires significant labor. If you need a topographical map as the base map for a thematic map, the USA Topo Maps base map will save you alot of time over creating a map from a DEM.
Symbolize The Data: Perspective Maps
Perspective is "the technique or process of representing on a plane or curved surface the spatial relation of objects as they might appear to the eye" (Merriam-Webster 2021).
Perspective views of terrain are visualizations as if seen by a bird or airplane flying above the terrain. Elevation is the height of the viewing location. Pitch is the angle indicting whether the perspective primarily looks down (high pitch) or looks across the terrain (low pitch).
In ArcGIS Pro, perspecitve views are referred to as scenes.
Note that working with scenes requires significant display computation time and memory, which may result in slow performance depending on your machine.
Create the Scene
- Insert a new Local Scene. Global scenes are for large areas as if viewed from space. Local scenes are for small areas as if viewed from an airplane.
- Add Data your DEM to that map.
- Right click the map in the Contents pane, select Properties, and change the Coordinate System to a Mercator or planar coordinate system. In this example of Moline, IL, we use a current Illinois East State Plane Coordinate System projection (EPSG 6456).
- Right click on the map in the Drawing Order, select Properties and General and give the scene a meaningful name (Perspective Map).
- If needed, right click on the elevation layer and select Zoom to Layer, which should center the DEM in the display window.
Set the Elevation Surface
- In the Contents pane under Elevation, click on Ground, select Add elevation source and add your DEM.
- Unselect the WorldElevation3D/Terrain3D elevation surface since you will use the DEM as your surface.
- Turn off the base map and base map hillshading as well.
- Click on Ground and in the Elevation Surface Layer tab, change Vertical Exaggeration to 10. The choice of what number to use here will depend on now much topographical variation is in your data and how much you want to exaggerate that variation to make it more prominent.
- You can adjust the view by Show Full Control icon at the bottom left of the scene, and then dragging on the different elements to change the different angles of view. Holding the CTRL key and draging on the ring changes the pitch (angle of view).
- If your system is slow and clicking on the screen causes pop-up dialogs to appear, select Map, Explore, and No Pop-ups.
- If you get lost in navigation, right click on the DEM layer in the drawing order pane and select Zoom to Layer.
Add False Coloring
- In the Contents pane, right click layer and choose Symbology.
- Choose a Color scheme. The green-brown color ramp works well for accentuating hills and rivers
- If desired, Format color scheme to customize the color ramp.
- Sharpness can be improved by selecting the Raster Layer tab, Rendering, Resampling Type and Cubic.
Adjust the Hillshading
- In Contents pane, select Ground and in the Elevation Surface Layer tab, select Shade Relative to Light Position.
- To get a more dramatic hillshading effect,
in the Contents pane,
right click on the overall map (Perspective Map)
and select Properties, Illumination.
- Select Display shadows in 3D.
- Leave the Azimuth at 315 (changes the seasonal angle of the sun).
- Change the Altitude to 40 (lowers the sun in the sky). >
Present Your Map
Direct Export
If you wish to get an image for a document that displays exactly what is displayed in your map window, you can Share and Export a PNG file.
You may want to hide the Contents pane before opening the Share dialog to get adequate width for your image.
Layout
If you want more control over the size and resolution of your exported map image, you can place terrain maps on a layout. The video below shows how to create a layout for a 6 x 4 figure that you can insert in a document.
Save Your Project
When you are finished with the project for the day, you should save a project package containing your work to ArcGIS Online. Your imported raster data will be saved with the package.
- Go to the Share tab and select Project.
- Provide a name to save the project under. The default is the name of the current project.
- Copy the name into the Tags and Summary fields.
- Click the Share outside of organization box so your GeoTIFF and your project database containing all of your layers is included in your project package.
- Unclick the Include Toolboxes and Include History Items check boxes so that history or toolbox errors to not cause your upload to fail.
- Change the sharing to Everyone if you need to share this project package with colleagues or an instructor.
- Analyze the project to find any problems.
- Package the project to upload it to ArcGIS Online. This may take a minute or two.
- If you need to share a link to your project package with a collaborator or instructor, you can view the information page for the package in ArcGIS Online and get the URL from the location bar.