Visualizing Foreclosure: Phoenix - Analysis
Indexed Summary Chart
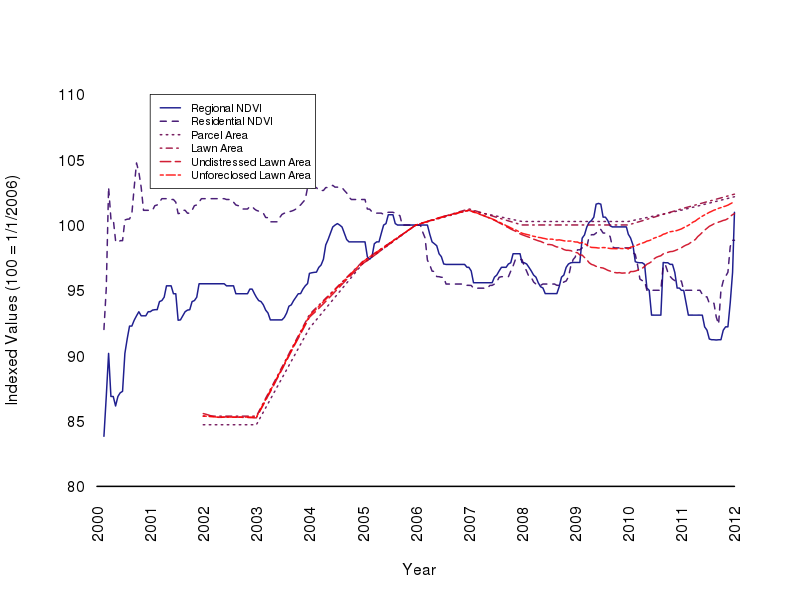
NDVI values are summed over the entire raster and an area masked to residential parcels. The values are smoothed with a 65-element-wide running median ("runmed()"). Using sums rather than means allows the residential NDVI value to be reflective of the increasing amount of land under management as the housing bubble expands and then stagnates. Given the persistence of physical infrastructure, metaphor of stagnation is more reflective of the physical environment than the metaphor of popping from the economic domain.
Parcel areas are expressed in terms of aggregate residential parcel area, aggregate potential lawn area.
Foreclosure is expressed negatively under the presumption that the amount of maintained vegetation should be more clearly thought of in relation the lawn area that is NOT distressed.
This chart distinguishes between parcels that are distressed (the process ends in a cancelled sale) vs those that are foreclosed (the process ends in a completed transaction and transfer to a new owner).
While the displayed range of index values is compressed to make the changes more clearly visible, it should be noted that the parcel changes are more subtle than implied by some of the map animations. Accordingly, any resulting environmental effects should also be subtle. This also makes the longer-term trends somewhat clearer, with the conclusion that the important environmental signal (from a resource utilization standpoint) may be the smoothed trend rather than the transient effects associated with individual parcels that we have been seeking thus far.
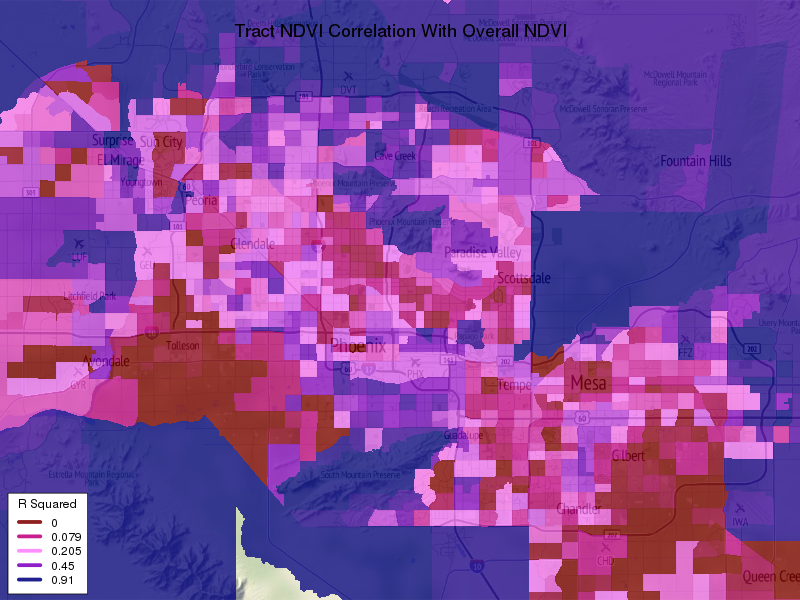
Tract vs NDVI Correlation
This diagram correlates NDVI for individual census tracts with overall NDVI for the area. Lower R-squared indicates deviation from overall NDVI cycles and is indicative of higher levels of managed landscape, including agricultural uses
Foreclosures vs USPS Vacancy
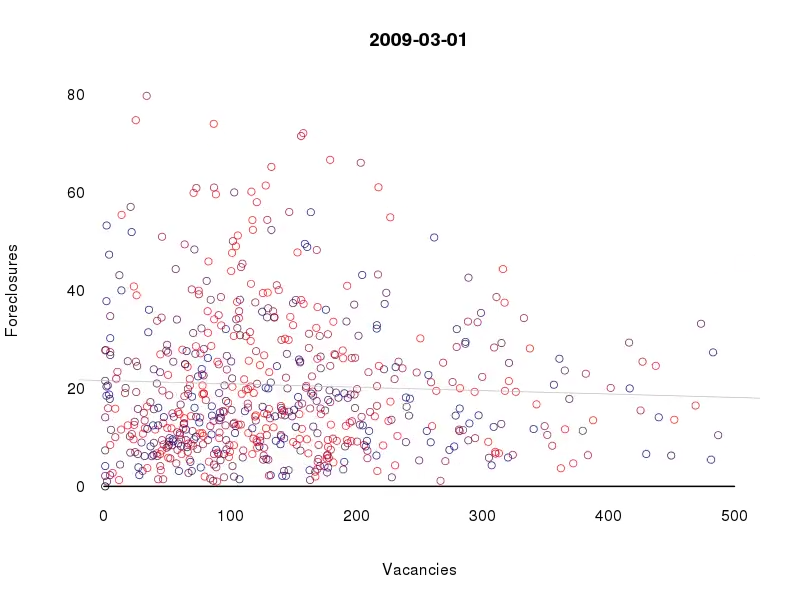
The validity and completeness of the USPS data is questionable. There are numerous tracts with counts of zero vacancy, notably outside the urban core, and it is not clear how consistent the tracking of this information is among the hundreds of different delivery staff members responsible for making observation of vacancy.
Regardless, the absence of even modest correlation for the tracts with high vacancy numbers continues to support the notion that foreclosure/vacancy relationship is complex.
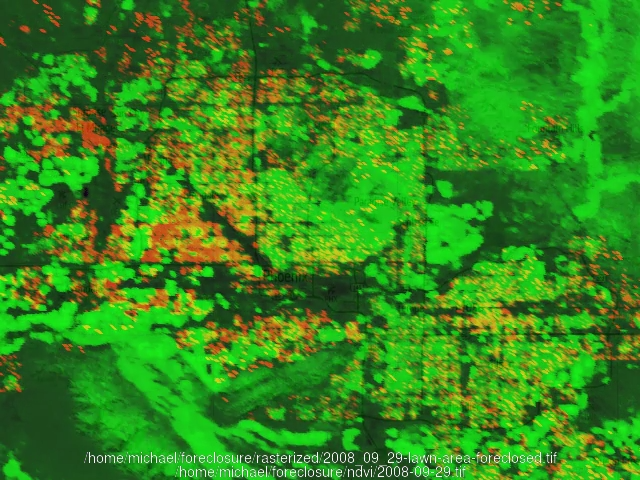
Animated Bichromatic NDVI vs Foreclosure
An alternative simultaneous animation that places NDVI in the green channel and foreclosed lawn area in the red channel.
- Areas with low foreclosure and high NDVI are green
- Areas with high foreclosure and low NDVI are red
- Areas with high foreclosure and high NDVI are yellow
Accordingly, the areas to look for are transitions from yellow to red as foreclosure results in curtailed lawn maintenance and dropping NDVI.
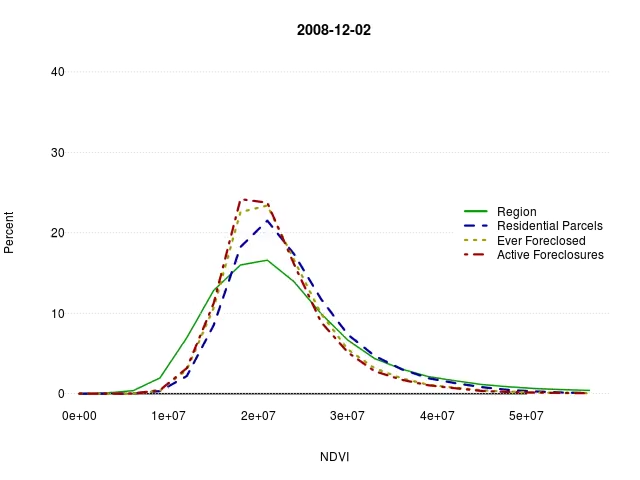
Animated NDVI Parcel Distribution
Animted chart of NDVI distribution oversampled by pixel centroid showing that foreclosed parcels tend to have a slightly lower NDVI than residential parcels as a whole.
- The green line is the overall NDVI
- The blue line is all residential parcels
- The red line is parcels currently in foreclosure (between NOS and sale date or cancellation)
- The brown line is parcels that ever have a foreclosure record
The red line (active foreclosures) is consistently shifted to the left of the line for all parcels, giving a possible hint that foreclosed parcels tend to have lower NDVI.
To make sure foreclosed parcels aren't special in having lower NDVI (smaller lots with, less-maintained lawns) in general, the brown line (parcels that are ever foreclosed) generally stays below the line for active foreclosures, until the lines converge during the housing crisis.
While this oversampling methodology with such large pixels may be ecologically fallacious, this does give some hint (but not proof) that the phenomenon we seek is real. Indeed, the complexity of the fine-grained spatial distribution may be mitigating large-grained patterns that would be visible in animation of Cartesian representations, making traditional cartography of limited value for observing the phenomenon.
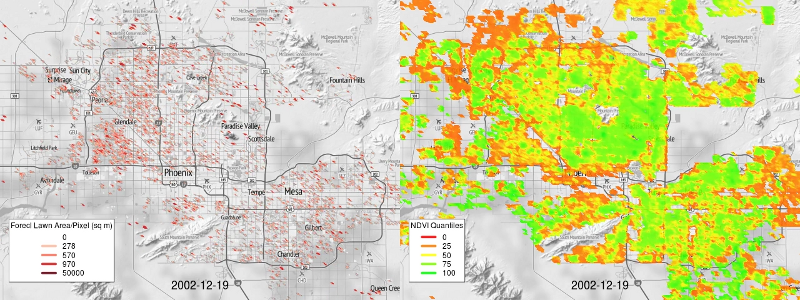
Animated NDVI vs Foreclosed Lawn Area
Side-by-side simultaneous animation of raw NDVI and foreclosed lawn area.
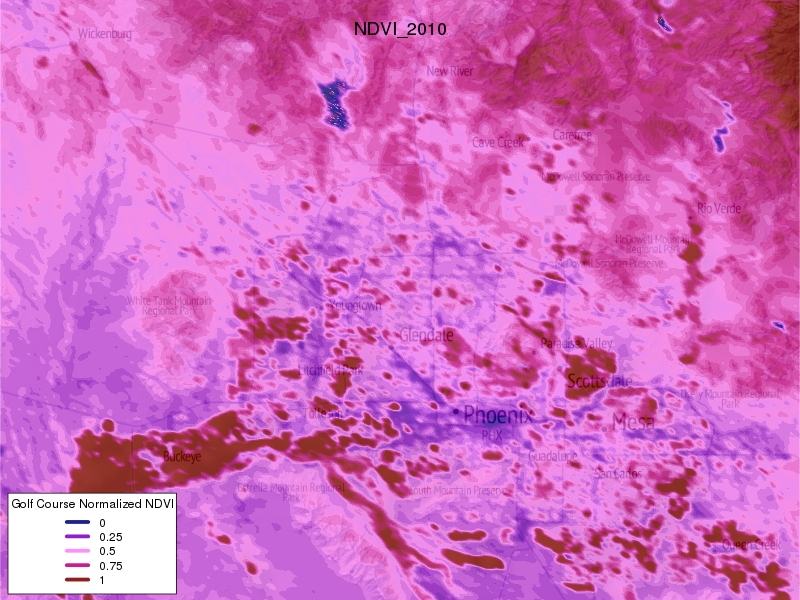
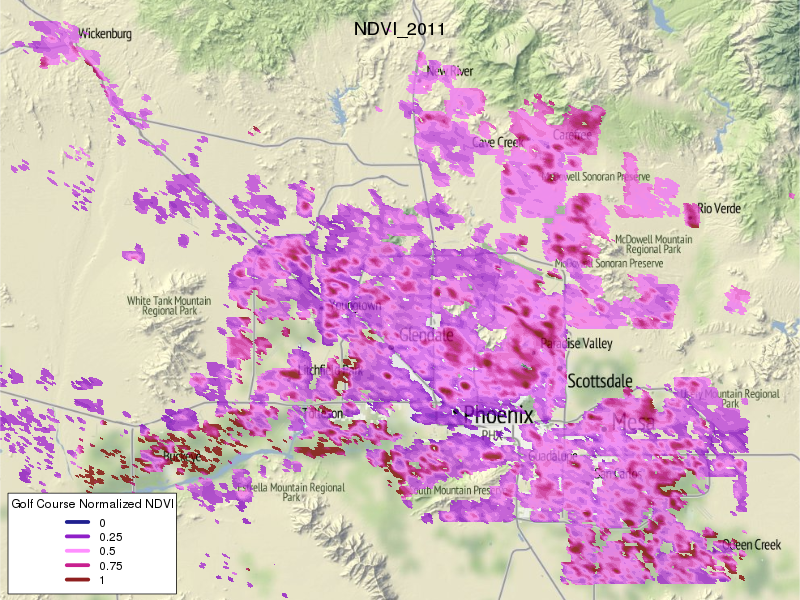
Animated Golf-Course Normalized NDVI
For the following animations, the raw NDVI data for January 2002 through January 2012 (a total of 231 layers) was input to a series of 4 processing steps:
- The raw data was smoothed using a 3x3 window mean smoother applied separately to each layer
- All variation due to seasonal patterns in NDVI. The method used can be found in /projects/oa/housing_bubble/scripts/MODIS/MODIS_seas_adj_errorsNAed.R
- Each layer was normalized to the mean NDVI for the TPC Scottsdale golf course by simply division. The mean golf course NDVI was calculated for each layer individually. The script used here can be found in /projects/oa/housing_bubble/scripts/MODIS/MODIS_golfnorm.R , and the TPC Scottsdale shapefile is stored in /projects/oa/housing_bubble/vector/phoenix/golf_courses/
- Finally, the annual mean of the smoothed, seasonally adjusted, normalized NDVI was calculated for year year 2002-2011, resulting in the output files
Animated NDVI vs High-Foreclosure Pixels
The animations below isolate the the top 20 pixels with exceptionally high foreclosure lawn area.
All those pixels are in exurban areas.
When no restriction is placed on parcel size, most of those high-lawn-area pixels reflect foreclosure of extremely large parcels that cover the bulk of one or more pixels. Therefore a single foreclosure causes a sudden and dramatic jump in foreclosed lawn area, even though referring to those massive properties as lawns is, literally, a bit of a stretch.
When the parcels used for calculating foreclosed lawn area are limited to 10K sq meters or lower, this starts to include a number of what may be troubled exurban developments.
From the animations, there do not appear to be any parcels that drop from consistently high NDVI (managed landscape) prior to foreclosure to low NDVI during foreclosure, which would be indicative of neglect due to vacancy. There are a number of pixels that have consistently high NDVI, but those are pixels that appear to contain adjacent agricultural fields.
The gray line is mean NDVI for the entire area.